In 2013, 3.3 million Americans worked in a job that paid at or below the federal minimum hourly wage of $7.25.[1] For many of these workers, finding affordable housing is a constant challenge. Still, nearly two-thirds of suburban minimum wage earners, and nearly half of urban minimum wage earners, owned their own home.[2] Of course, the ownership rate does not capture important differences in home size, amenities, convenience and quality, but is nonetheless illustrative of the options that minimum wage earners frequently encounter.
Using a unique Zillow database of all homes in each of the top 35 metro areas, we estimate the share of homes that minimum wage earners can afford to buy under current minimum wage requirements. It was necessary to make several assumptions about the labor supply, household structure and personal finances of minimum wage earners. To inform these assumptions, we used data from the March 2014 Supplement Current Population Survey—commonly known as the Annual Socio-Economic Supplement (ASEC)—and the 2012 American Community Survey (ACS) to estimate the number of hours minimum wage earners work per week, the number of workers per household and the share of income dedicated to mortgage payments.[3]
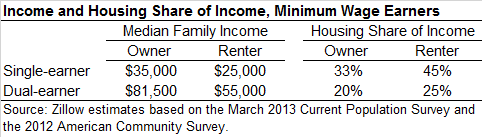
According to this analysis, minimum wage earners residing in urban and suburban communities typically work 40 hours per week and 52 weeks per year.[4] Two-thirds reside in dual-earner families. Median family income for homeowners and renters in single- and dual-earner families is presented in the table below. The median family income for homeowners in dual-earner families was $81,500, while for single-earner families it was $35,000. Among renters, family income was much lower: In dual-earner families it was $55,000 compared to $25,000 in single-earner families. The median share of income dedicated to mortgage or rental payments also varies across these groups—ranging from about 20 percent among dual-earner homeowners to 45 percent among single-earner renters (see table below).[5]
Additional assumptions are necessary with respect to the mortgage loan structure selected. Given that minimum wage earners are likely to be relatively high-risk borrowers, we assume that they finance their home purchase using a 30-year fixed rate loan backed by the Federal Housing Administration (FHA), a 3.5 percent down payment and current interest rates for borrowers with a credit score toward the lower bound of conventional lending (between 640 and 679)—roughly 5.3 percent.[6] Finally, we assume that the borrowers have no additional monthly debts and have previously saved to fund the down payment and any related closing costs.
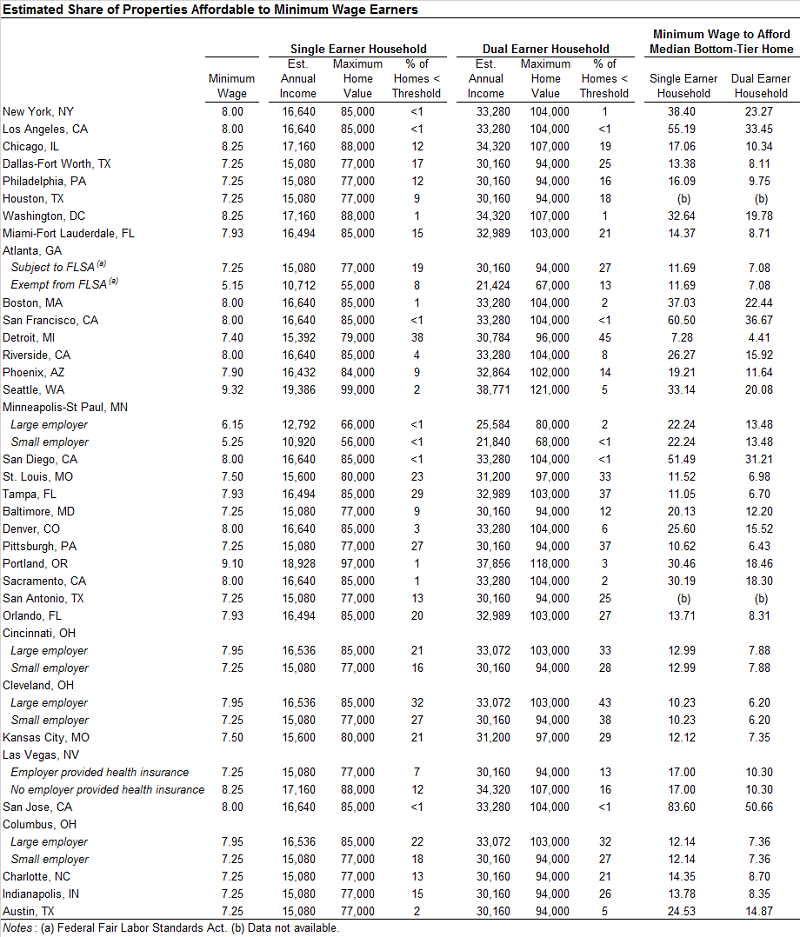
With these assumptions, we calculate a maximum affordable home value for single- and dual-earner families, and the number of properties in the top 35 metro areas that fall below the threshold, based on current prevailing minimum wages. In some states, minimum wages differ depending on the size of the employer, whether health insurance is provided or the applicability of the Federal Fair Labor Standards Act (FLSA).[7] The table below reflects these special scenarios. Finally, we calculate the minimum wage necessary for single-earner and dual-earner households to be able to afford the median bottom-tier home (which reflects homes in the bottom third of the housing stock) in the metro area. The results are presented in the table below.
The results show the striking differences in home affordability across the country. For instance, households with two minimum wage earners can afford to buy over 40 percent of Detroit homes, but almost no homes in Los Angeles, San Francisco, San Diego or San Jose. For single-earner households on minimum wage, the options are even fewer, with essentially no affordable homes in New York, Los Angeles, San Francisco, Minneapolis, San Diego or San Jose, and only a tiny number (1 percent of the housing stock) of affordable homes in Washington, DC; Boston; Portland and Sacramento.
Similarly, the minimum wage necessary to afford to buy the median bottom-tier home varies substantially across metro areas. In 14 of the top 35 metro areas, the current minimum wage is roughly in line (within $2 per hour) with the minimum wage necessary to afford to buy the median bottom tier home; in four metro areas, it is within $1 per hour of the necessary minimum wage—including Dallas-Fort Worth, Miami-Fort Lauderdale, Orlando, Cincinnati and Columbus. Moreover, the current minimum wage exceeds the minimum wage necessary to afford the median bottom tier home in Detroit, St. Louis, Tampa, Pittsburgh, Cleveland and for some workers in Atlanta, Cincinnati and Columbus. By contrast, the minimum hourly wage would have to be $50.66 in San Jose, $36.67 in San Francisco, $33.45 in Los Angeles and $31.21 in San Diego in order for minimum wage workers to be able to afford the median bottom-tier home.
Of course, in reality, many minimum wage workers in these metro areas adapt to high prices by renting, concentrating in certain communities where prices are lower or by commuting longer distances, frequently crossing metro areas—for instance, from Riverside to Los Angeles. However, the findings above are illustrative of the broad challenges low-wage workers face finding housing in these communities.
[1] U.S. Department of Labor, Bureau of Labor Statistics, Characteristics of Minimum Wage Workers: 2013, March 2014.
[2] Zillow analysis of data from the March 2013 Socio-economic Supplement to the Current Population Survey (CPS).
[3] Data made available by Miriam King, Steven Ruggles, J. Trent Alexander, Sarah Flood, Katie Genadek, Matthew B. Schroeder, Brandon Trampe, and Rebecca Vick, Integrated Public Use Microdata Series, Current Population Survey and American Community Survey: Version 3.0, [Machine-readable database], Minneapolis: University of Minnesota, 2014.
[4] To identify individuals earning at or below minimum wage, we compiled state minimum wages that prevailed in 2012, including instances where different minimum wages applied to large- and small-employers, and mapped these thresholds onto ASEC data for civilian employed prime working-age adults (25-54) who reported earning an hourly wage. Historical data on state minimum wages are available from the U.S. Department of Labor at http://www.dol.gov/whd/state/stateMinWageHis.htm.
[5] Monthly rental or mortgage outlays are not available in ASEC data, while hourly wage data are not available in ACS data. To estimate the housing outlay share of income, we used ACS data to calculate the ratio of gross rent and total mortgage payments to annual family income (divided by 12) for civilian employed prime working-age (25-54) adults in a 10 percent band around the median family income for each group reported in ASEC.
[6] Average rate quoted on the Zillow Mortgage Marketplace between May 1, 2014 and June 13, 2014 for 30-year fixed rate FHA purchase loans for borrowers with credit scores between 640 and 679.
[7] Data from the U.S. Department of Labor, accessed June 17, 2014, http://www.dol.gov/whd/minwage/america.htm.
