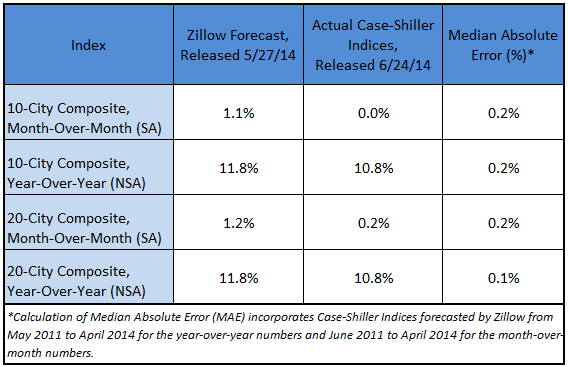
Today, the S&P/Case-Shiller Home Price Indices showed that the non-seasonally adjusted (NSA) April 10- and 20-City Composites each rose 10.8 percent on a year-over-year basis, in line with Zillow’s forecast released last month. On a seasonally adjusted (SA) monthly basis, the 10- and 20-City Composites were flat and up 0.2 percent, respectively, from March to April. The table below shows how Zillow’s forecast compared with the actual numbers.
“There’s no doubt that these can be confusing times for ordinary people trying to read the tea leaves. Home sales are up for the month, but down for the year. Case-Shiller is way up for the year, as always, but slowing. Inventory is coming back, but not at the low end of the market. Negative equity is falling, but is still extraordinarily high in many areas,” said Zillow Chief Economist Dr. Stan Humphries. “The reality is that the market is moving from one defined by distortions including high negative equity and constricted inventory, to one defined by fundamentals like household formation rates, jobs and income growth. Unfortunately, some of these fundamentals are still fairly weak. This is a multi-year process that we are far from done with. This ride is not for the faint of heart, but we are slowly getting back to normal.”
Our forecasting model incorporates previous data points of the Case-Shiller series, as well as Zillow Home Value Index data and national foreclosure resales. To see how Zillow’s forecast of the March Case-Shiller indices compared, see our research brief from last month.
