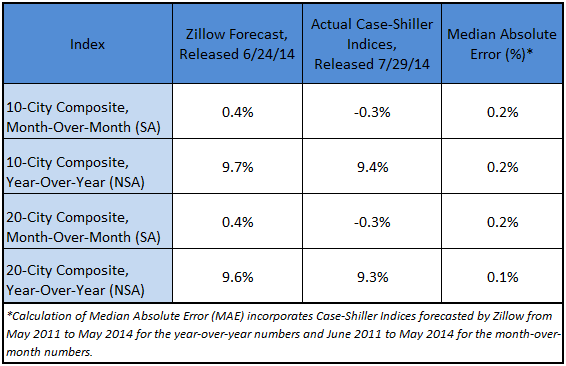
Today, the S&P/Case-Shiller Home Price Indices showed that the non-seasonally adjusted (NSA) May 10- and 20-City Composites rose 9.4 percent and 9.3 percent, respectively, on a year-over-year basis, in line with Zillow’s forecast released last month. On a seasonally adjusted (SA) monthly basis, the 10- and 20-City Composites both fell -0.3 percent from April to May. The table below shows how Zillow’s forecast compared with the actual numbers.
“Nationally, today’s Case-Shiller data is consistent with the slow glide path down towards a more normal housing market we’ve been experiencing for the past few months. But the national numbers are masking a lot of variation from city-to-city: Cleveland, for example, is performing a lot differently than the Bay Area,” said Zillow Chief Economist Dr. Stan Humphries. “And even within local markets, the entire housing stock is not performing the same. Almost across the board, lower-priced homes have been appreciating more quickly than the most expensive homes, a welcome reversal from prior years. This is driven by higher affordability at the bottom tier, which boosts demand; and much higher negative equity rates at the lower end of the market, which keeps supply tight. These conditions are typical of a housing market recovery in which every layer of the onion we peel off reveals something different.”
Our forecasting model incorporates previous data points of the Case-Shiller series, as well as Zillow Home Value Index data and national foreclosure resales. To see how Zillow’s forecast of the April Case-Shiller indices compared, see our research brief from last month.
