The Elusive Truth on Domestic Migration: Comparing Data Sources on U.S. Cross-County Migration
When it comes to regional migration within the United States – one of the most important factors influencing local demand for everything from homes to schools and roads – there are at least three, sometimes dramatically different though all semi-official, data sources.
Mark Twain is famous for saying that a man with one watch always knows what time it is while a man with two never does. Unfortunately, when it comes to regional migration within the United States – one of the most important factors influencing local demand for everything from homes to schools and roads – there are at least three, sometimes dramatically different though all semi-official, data sources.
There are small differences in precisely what they measure and how they measure it, making drawing definitive conclusions about regional migration within the United States difficult to pin down. This already complex task has become even more difficult with the addition of various unofficial data sources on online search patterns, which are often referenced as a leading indicator of regional migration.
In two recent analyses we looked at the metro areas that are most attractive for home buyers and renters on Zillow looking to move from one part of the country to another. For housing markets, demand shocks – the increase in housing demand because of new residents moving into an area from elsewhere in the country (or the world) – are an important driver of price trends.
It has become increasingly popular to draw conclusions about national migration patterns based on online search trends, but it’s something Zillow has historically shied away from. Consumers’ online search behaviors often reflect aspirations or curiosities as much as any kind of actionable intent. Put another way: A Zillow user might look at homes in Seattle from their couch in New York not because they actually intend to move to the Pacific Northwest, but simply because they’ve always wondered what it’s like there or because they are viewing the home of a friend or relative. So while online search data certainly does contain some real, forward-looking signals, depending on the source, the signal is unlikely to be strong enough to merit extrapolating real-life trends without first modeling the relationship between the search data and some more authoritative truth.
But, frustratingly, it’s surprisingly difficult to cross reference these patterns in search data against a more authoritative, on-the-ground truth.
Other data sources on where people move in the United States disagree, sometimes substantially, and are hampered by conceptual and measurement differences. The answer to whether more or fewer people are moving to a particular place, and where they are coming from, depends a lot on when you ask and how you frame the question.
We compared three of the most authoritative data sources on cross-county moves within the United States:
- Official population estimates from the U.S. Census Bureau
- The American Community Survey (ACS)
- County migration trends data from the Internal Revenue Service (IRS)
Each of the sources measures slightly different concepts, so some differences should be expected. But even with these conceptual differences in mind, the three data sources can produce very different estimates of cross-county migration flows.
The Data Sources
Each year the Census Bureau publishes county-level estimates of population change, including components such as domestic migration. These estimates are derived from a range of sources including tax records, surveys, the most recent decennial census, health insurance records and vital statistics (births and deaths). All correspond to movement between July 1 of the prior year and June 30 of the reference year. Estimates are updated following each decennial census. (In this analysis, we compare only estimates based on the 2010 Census.) These estimates are perhaps the closest thing we have to “authoritative” estimates of internal migration, although they do not permit secondary analysis – such as movements across metro areas (which are themselves groups of counties) – or analyses at the household rather than the individual level.
The ACS is an annual survey of 1 percent of the American population conducted by the Census Bureau. It asks respondents whether they lived in their current home or apartment one year earlier. Since the survey is conducted throughout the reference year, it could include anything from a move between Januarys of consecutive years to a move between Decembers of consecutive years, but on average corresponds to a move between July of the previous year and June of the reference year. Although there is no specific variable identifying whether an individual moved across county lines, it is possible to compare where a respondent currently resides (at the time of the survey) and where they lived a year earlier. The ACS data are published in two formats: tabulations prepared by the Census Bureau, and public-use microdata. The microdata allow more flexibility for custom tabulations, but also limit an analyst’s ability to examine small geographies.
Finally, County-to-County Migration Data published by the IRS are based on tax records. Once the majority of taxes are filed (by September of the year following the tax year), the IRS matches records with data from previous years and computes the number of taxpayers and dependents for whom the filing address has changed. It then publishes tables of the number of taxpayers who moved across counties between their two consecutive federal tax filings. Taxpayers correspond roughly (though not exactly) to households, while taxpayers and dependents correspond roughly to individuals. Most taxes are filed in April, so roughly the data correspond to moves between Aprils of consecutive years. In some instances, a person’s tax address may not correspond not their residence.
Comparisons
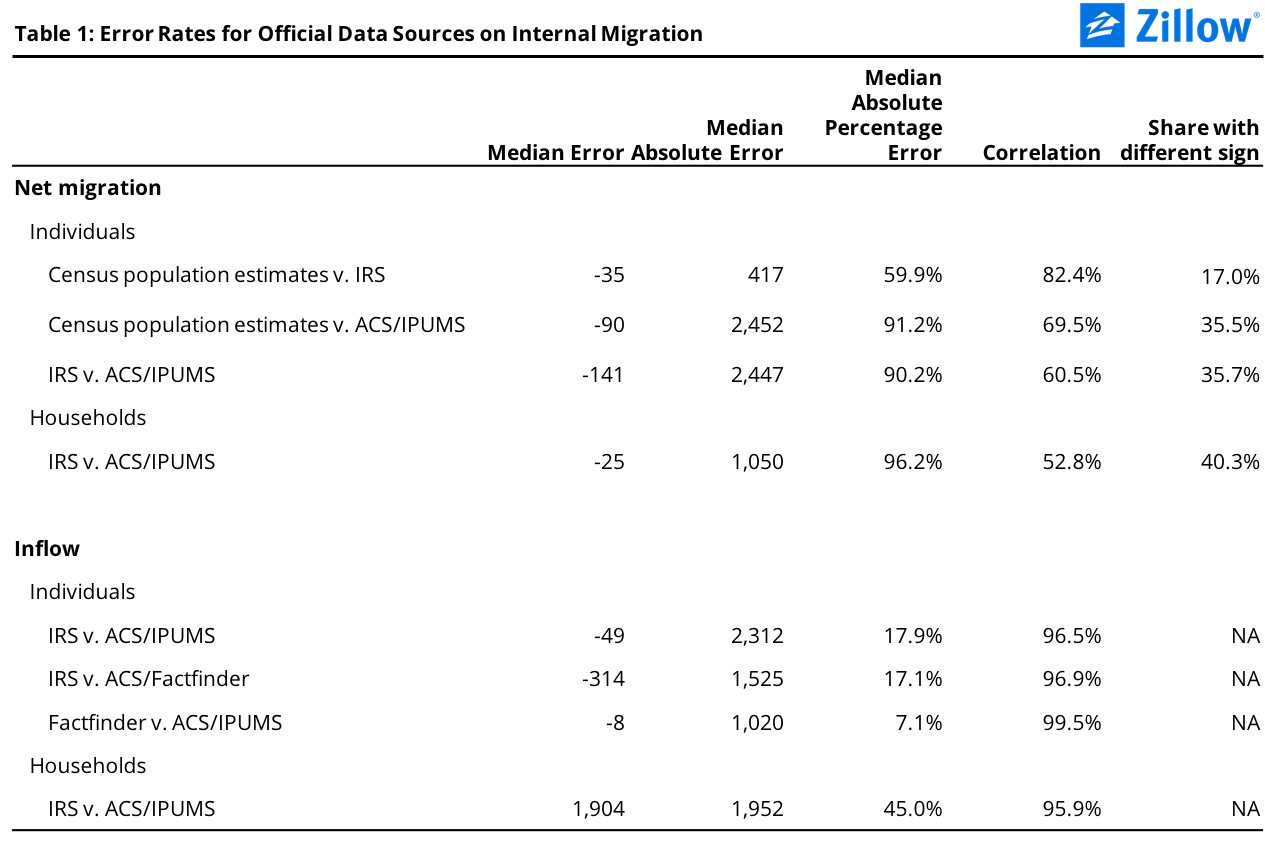
The figure below includes eight comparisons of the different cross-county migration data sources. Comparisons labeled “net flow” show the balance of cross-county migrants in a given year – the inflow minus the outflow – while the charts labeled “inflow” show only the number migrants from outside the county. The comparisons are done at two levels – the individual level and the household level (exemption and taxpayer levels, respectively, in the IRS data). Hover over any dot to see the county and estimates for a particular year.
On average, between 2011 and 2014 for the typical county for which we have data, the IRS estimates of net cross-county migration were off from Census official estimates by 417 people, a median absolute percentage error rate of almost 60 percent (table 1). For 17 percent of counties, the signs of the estimates were different, meaning one data source suggested the county experienced a net population inflow while the other suggested the county experienced a net population outflow. The error rates were higher when comparing official population estimates with estimates from the American Community Survey.
When comparing net household migration in the ACS to net taxpayer migration in the IRS data, the median absolute error rate between 2011 and 2014 was 1,050 households/taxpayers and in 40 percent of counties, the sign of the change in the two data sources was different.
The divergences between the trends implied by various data sources on internal movements in the United States suggest users should be cautious in drawing definitive conclusions from any single data source. Official data sources based on surveys and administrative records – much less online search data which are even noisier – can point to sharply different trends.
In general, users should rely on the Census Bureau’s official cross-county migration estimates as the most authoritative source for net population inflows. When other data sources – including ACS tabulations/microdata and IRS – are necessary to compute movements for aggregate areas or to link origins and destinations, county-level reliability should first be tested using official estimates, and outliers interpreted with appropriate caveats or exclusions.

