Fixer-Uppers on the Upswing
A lack of new home construction in the wake of the housing bust – especially in some of the nation’s hottest and most desirable housing markets – coupled with an aging housing stock is leading to a bump in the share of homes listed for sale in need of a little TLC.
- Across the largest 50 metros, the frequency at which sellers list their homes as fixer-uppers varies considerably. In Las Vegas, there are only 2.2 fixer-upper listings for every 1000 homes. In Los Angeles, there are almost 18.
- There’s a strong relationship between the age of housing stocks and the frequency of fixer-upper listings.
- Diminished new construction over the past decade means the housing stock is aging, which in turns means fixer-uppers are on the rise.
A lack of new home construction in the wake of the housing bust – especially in some of the nation’s hottest and most desirable housing markets – coupled with an aging housing stock is leading to a bump in the share of homes listed for sale in need of a little TLC.
You might think that the hottest housing markets are the least likely to see real estate listings marketed as fixer-uppers, but think again. San Francisco, Los Angeles, and Portland were three of the top markets in which homes classified as “fixer-uppers” [1] were most commonly listed for sale between 2011 and 2015. For every 1,000 homes listed for sale in these areas, between 15 (Portland) and 18 homes (Los Angeles) were listed as fixer-uppers. Compare those rates to a market like Las Vegas, which was rocked by negative equity and foreclosures and might be expected to have more dilapidated homes in need of fixing up. Instead, Vegas had the lowest frequency of fixer-upper listings among the largest 50 markets: For every 1,000 Vegas homes listed for sale, only slightly more than two could be pegged as a fixer-upper.
So what gives? Tight inventory explains part of the story; San Francisco, Sacramento, San Jose, and Los Angeles are all suffering from constricted inventory. Each of these markets has seen under 1 percent of their housing market listed for-sale any month this year (compare that to Vegas which has over 2 percent of its housing stock listed at a given point). And while constrained inventory does pose a number of challenges in these kinds of hot markets, opting for a fixer-upper does have some benefits. Fixer-upper homes nationwide list for just 8 percent less than market value, which for the median fixer-upper would save buyers only $11,000 about for necessary renovation projects. And while no two fixer-uppers are alike of course, buyers are more likely to find large upfront cash savings on fixer-uppers in expensive markets, where just a small percentage discount could yield quite a bit of money to spend on renovations. For example, fixer-uppers in San Francisco are discounted only 10 percent, which is lower than other metros according to recent Zillow research, but still gives buyers $54,000 in upfront savings for renovations on the median home. Other metros with high cash savings include San Jose ($38,000) and Seattle ($24,000).
But inventory only tells half the story, and there’s a more correlated variable with fixer-upper frequency. Fixer-uppers are like a fine wine—they need time to age. As you would expect, fixer-upper listings tend to be much older than other listings. Three in four fixer-uppers were built earlier than 1980, whereas less than half (46 percent) of non-fixer-upper listings were built pre-1980.
Given the age distribution of fixer-uppers, it should come as no surprise that housing markets with older homes see a higher frequency of fixer-uppers. San Francisco and Los Angeles top the list of both fixer-upper frequency and percent of homes more than 30 years old. Only 30 percent of homes in these markets were built in the past 30 years.
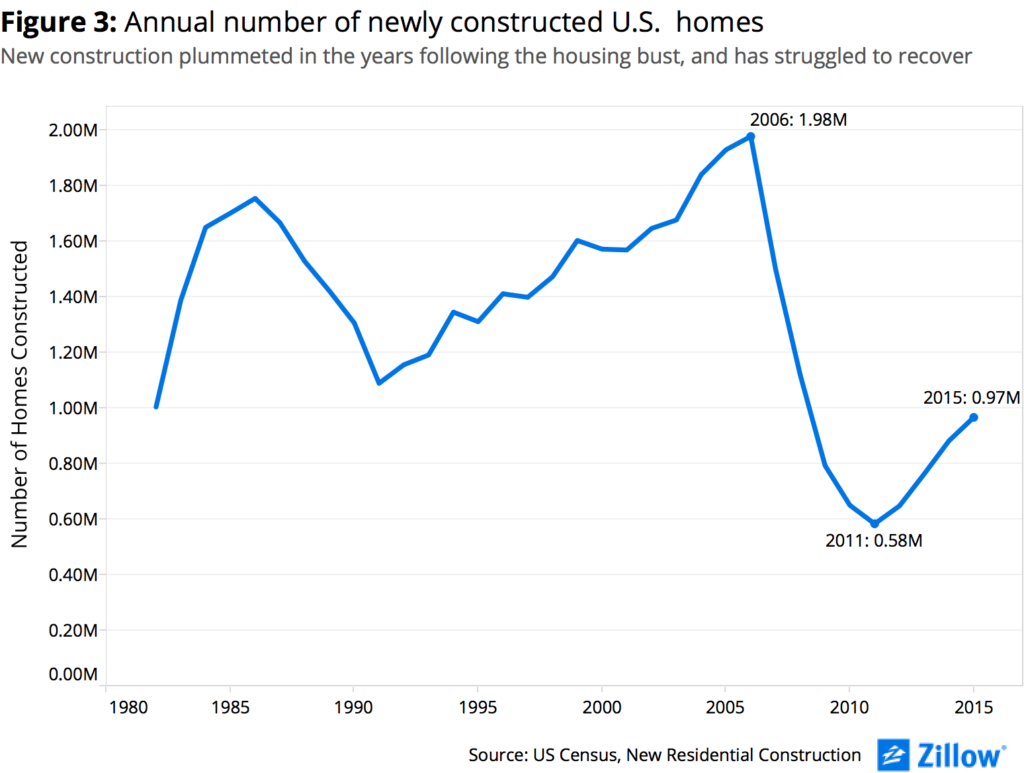
This relationship is especially important to note in the context of the current housing market. When the housing bubble collapsed, new construction dropped precipitously – and has yet to fully recover. For example, only half a million homes were built in 2011 according to the U.S. Census Bureau, less than in any other year since 1980 and a 75 percent drop from 2006 peak levels.
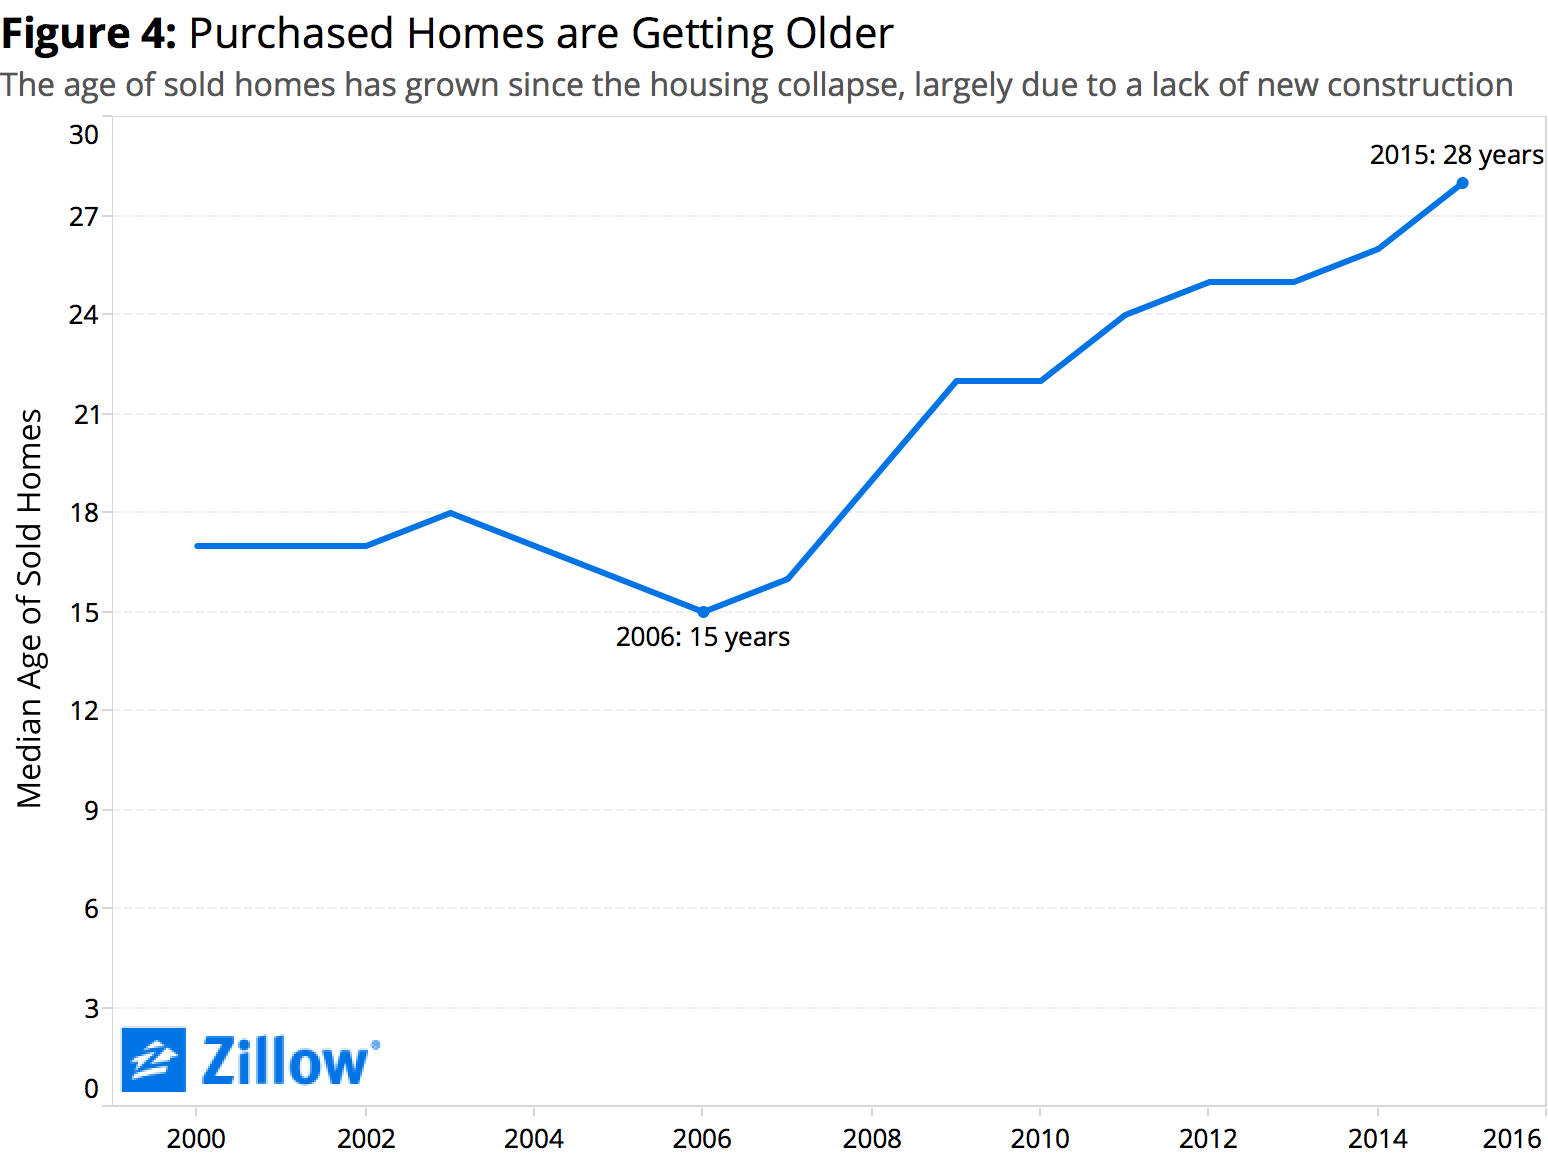
 This lack of home building means that homes currently listed and sold are now older than ever before. Across the top 50 metros, the median year built of homes sold in 2006 was 1991. In 2015, the median home purchased was built in 1987. That means that the age of the typical home sold almost doubled in less than a decade (15 years-old in 2006 to 28 years-old in 2015).
 Given this trend of older homes listing and transacting, we should expect to see the frequency of fixer-upper listings grow. We’ve already started to experience this trend. Across the largest 50 metros, the number of homes listed for sale overall dropped 10 percent between 2011 and 2015. But over the same time, the number of fixer-upper listings actually grew by 10 percent.
If you are thinking about buying soon, binge-watching the first three seasons of HGTV’s Fixer Upper might be a savvy way to spend a weekend (that or old clips of Tool Time).
[1] To identify fixer-upper listings, we mined our listing description database for terms like “fixer”, “tlc”, “good bones”, and “needs work”.


