- Zillow uses a latency-adjusted count to calculate home sales, a different methodology than the leading series.
- Zillow counts total homes sales as recorded by the county, capturing all real-estate transactions.
- The Zillow series is built on a different data footprint than other series, only including arm’s length transactions of new and existing “standard” home sales.
This month, Zillow released a new metric measuring total sales volume in a given month and over time. Headlining the release was the fact that seasonally adjusted home sales, while up slightly since July (up 0.5 percent month-over-month in August), are down 4.1 percent on a year-over-year basis. The leading sales series on existing home sales, reported by the National Association of Realtors (NAR)[1], was also released recently. While the stories told by Zillow and NAR in August were similar, it is important to recognize both how the data series themselves differ and that they may move in different directions in the future.
The metrics are computed with fundamentally different methodologies. Zillow’s footprint is different than NAR’s. At its core, the Zillow series is simply a count of transactions, adjusted for latency on the leading edge. In other words, Zillow counts the number of recorded transactions in a given area and adjusts the count on the leading edge for transactions that may have closed in one month but weren’t fully recorded until later. Not all real estate transactions must go through a multiple listing service (MLS), but real estate transactions of all types must be recorded by the local county government. “Transactions” is a broad term in this context. The Zillow series only considers arm’s length sales that would typically be considered a “standard” real estate transaction, including REO sales, auctions and for-sale-by-owner transactions. In contrast, the NAR series is computed from a sample of existing home sales that go through an MLS[2], a different footprint than the Zillow series.
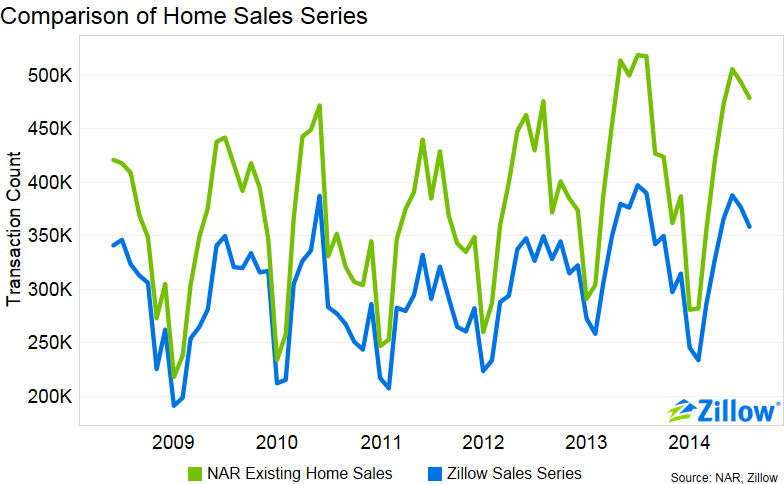
Figure 1 compares the two series. There is a level difference between the series, though this difference is reasonably constant over time. Given that this level difference is observed across the entire history of the series, not just the leading two years where latency adjustment is performed in the level series, it is reasonable to conclude that the source of this difference is not because of the latency adjustment.
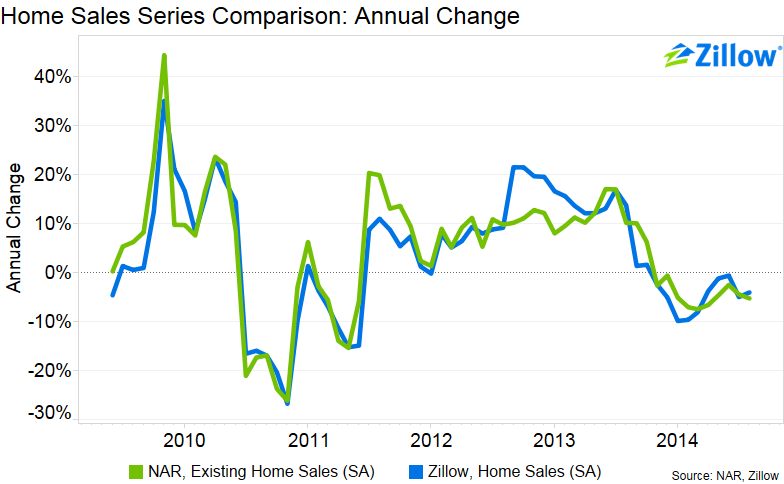
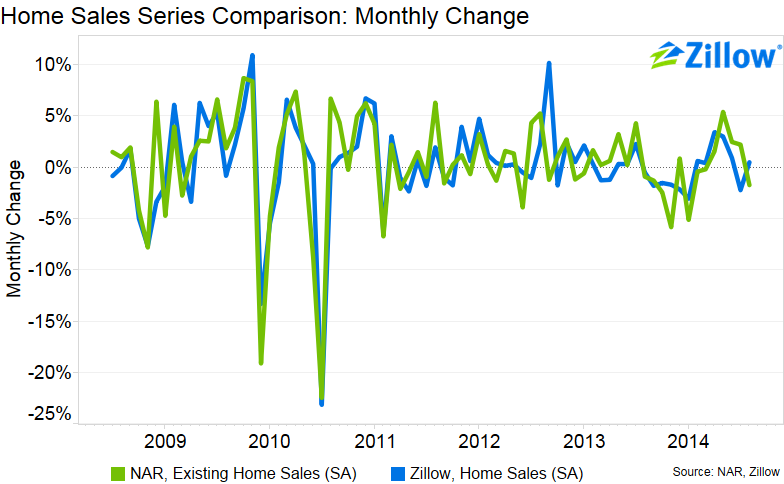
That said, levels can be difficult to interpret. For many, understanding what it means for home sales to increase from, say, 250,000 to 270,000 is difficult. Changes over time are generally more useful in helping to understand how the market is changing. Accepting some typical volatility in the monthly changes, the two series tell very similar stories over time, both month-over-month and year-over-year. Sales grew annually on a seasonally adjusted basis through summer 2013, but that growth turned negative last fall. Neither series has shown positive annual growth since then.
Zillow’s new sales series gives an accurate representation of what people expect a sales series to be: A count of the number of “standard” home sales recorded with counties. The data is also timely, typically released before NAR’s monthly data release. In addition, it is available for a wider set of geographies and goes further back in time than the publicly available competing series.
[1] Source: http://www.realtor.org/news-releases/2014/09/existing-home-sales-slightly-lose-momentum-in-august-as-investor-activity-declines
[2] Source: http://www.realtor.org/topics/existing-home-sales/methodology
