- Median home values in more than a quarter of the nation’s metro housing markets are currently, or were recently, as high as they’ve ever been.
- In February, home values rose 4.3 percent year-over-year to a Zillow Home Value Index of $184,600.
Median home values in more than a quarter of the nation’s metro housing markets are currently, or were recently (within the last year), at peak and as high as they’ve ever been, according to the February Zillow Real Estate Market Report. But what do home value peaks really mean?
As with most things in real estate, the answer depends on where you are.
The national Zillow Home Value Index was $184,600 in February, 5.9 percent below the record median home value set in mid-2007. But over the past year, many housing markets in the South, especially Texas and Tennessee, have joined many Western housing markets in blowing past their previous median home value highs. Dallas home values set a new record at $180,700 in February, up 13.7 percent from last February. Nashville home values rose 9.5 percent to a median of $189,100.
In a general sense, the idea of home values being at their “peak” is easy to take out of context. In a normal market – in which nominal home values grow fairly consistently year after year at a roughly 2 percent to 3 percent annual pace – home values are always reaching new peaks. In this example, home values in Anywhere, USA, can be reliably counted upon to be modestly higher this year than they were last year, and to be a bit higher next year than they are this year. Aside from periodic slowdowns or small dips in home values caused by local economic factors, nominal home values should always just keep chugging slowly upward in normal times.
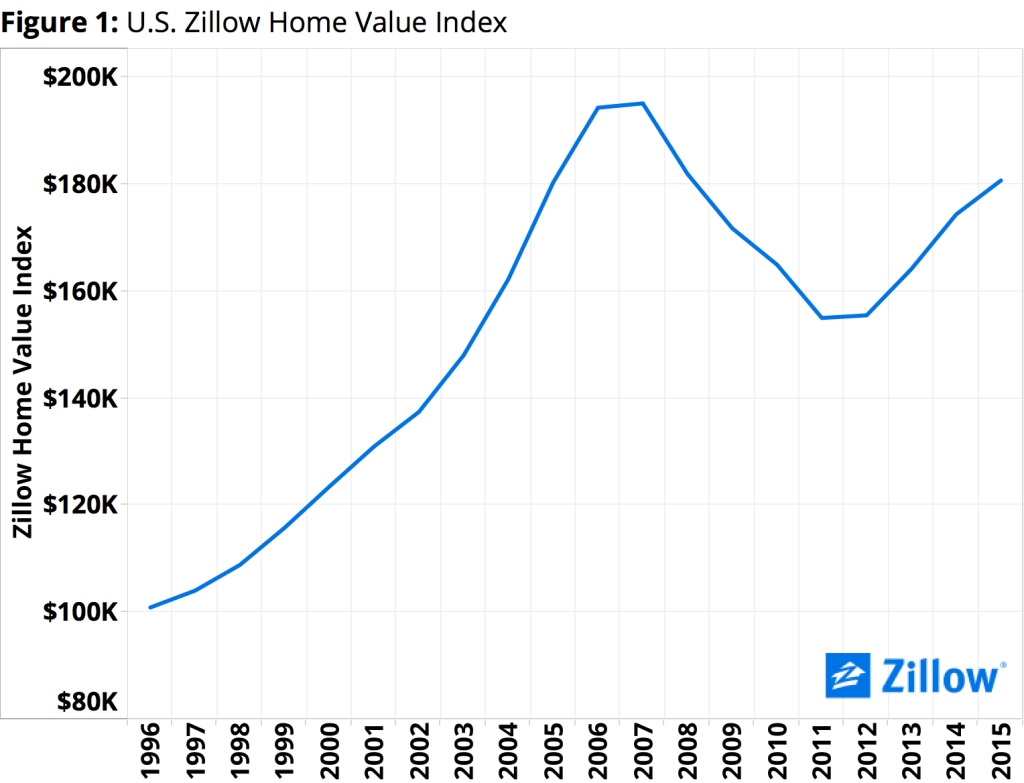 But the past decade-plus has been anything but normal for U.S. housing, which has distorted this definition of “peak” home values. By now we’re all familiar with housing’s rough arc in the 21st century: a rapid acceleration in home value growth between roughly 2000 and 2007, followed by an almost equally rapid decline from May 2007 through early 2012 and then a steadier climb back again in more recent years (figure 1). The very broad nature of last decade’s housing boom and bust means that the majority of local markets have followed a similar path as the U.S. as a whole, though the severity of their local booms and busts and exact peak and trough dates will vary somewhat.
But not all local markets experienced the housing boom, bust and recovery the same way. Some markets just kept chugging away slowly, never really falling much in the first place. It has taken others years to slowly claw their way back to pre-recession levels after a difficult bust. And still others had only a mild bust period, recovered quickly and have been setting new peaks for years.
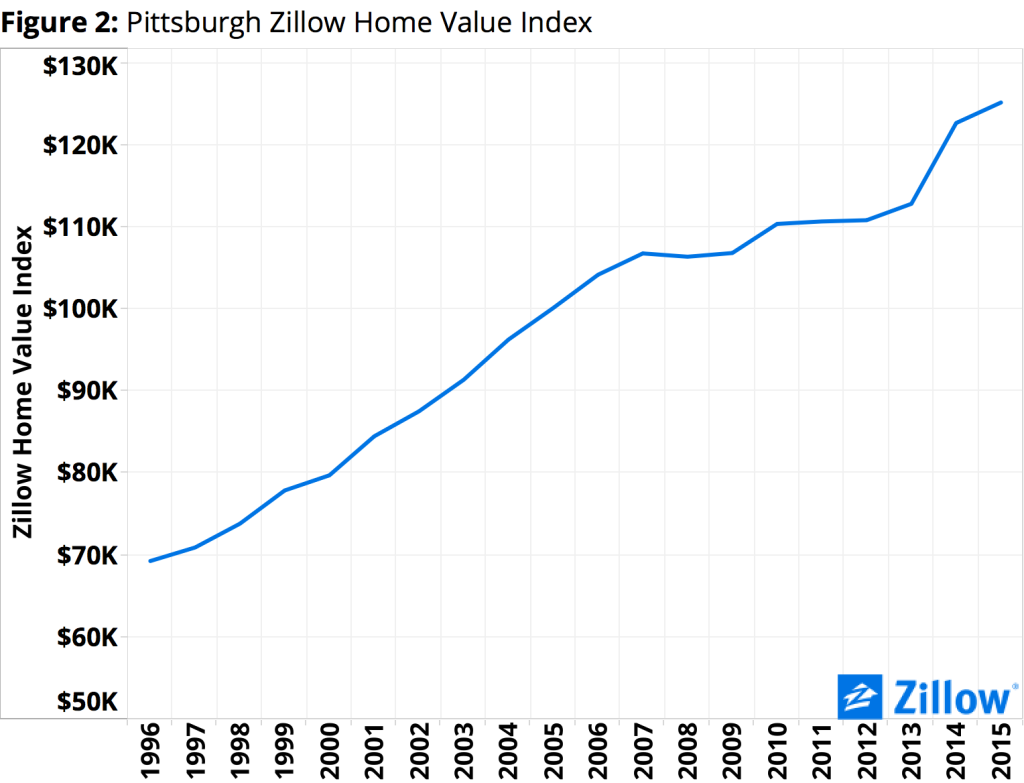 Pittsburgh is a good example of a market that has just kept chugging along, with no clear boom and bust period, only steady growth over the past two decades. Rather than experience a sharp dip during the bust, home values in the Pittsburgh area more or less flattened out without falling too much between 2008 and 2013, before resuming their somewhat more rapid rise during the recovery (figure 2). Far from being a cause for concern, the fact that home values in Pittsburgh are currently hovering very near their “peak” is really just a sign of remarkable stability in the market.
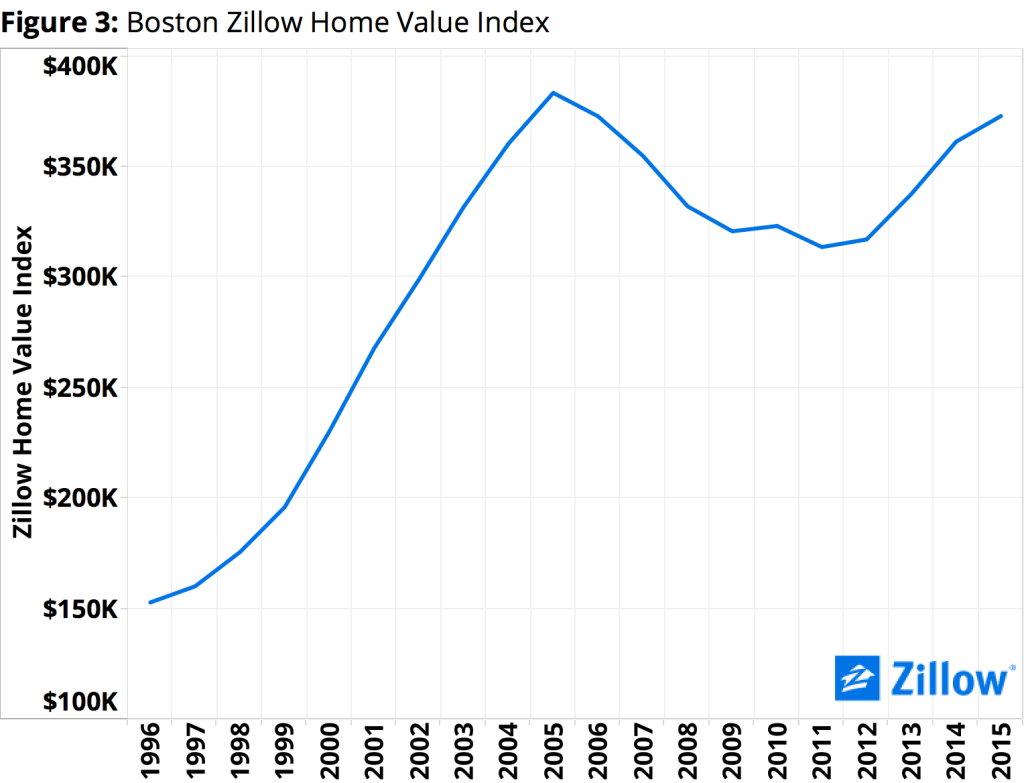 Boston is an example of a market that had a clear run-up in home values, a distinct decline during the bust, and a long recovery over the past few years (figure 3). During the boom years, home values in Boston peaked early relative to the nation, at $384,900 in September 2005. What followed was a long six-year period of falling home values, reaching bottom in November 2011 at $311,800, a drop of almost 19 percent. It took until January 2016 for home values in Greater Boston to surpass their prior peak. Home values in Greater Boston are, after years of bust and recovery, finally starting to break new ground again, and look to be on a sustainable growth path going forward.
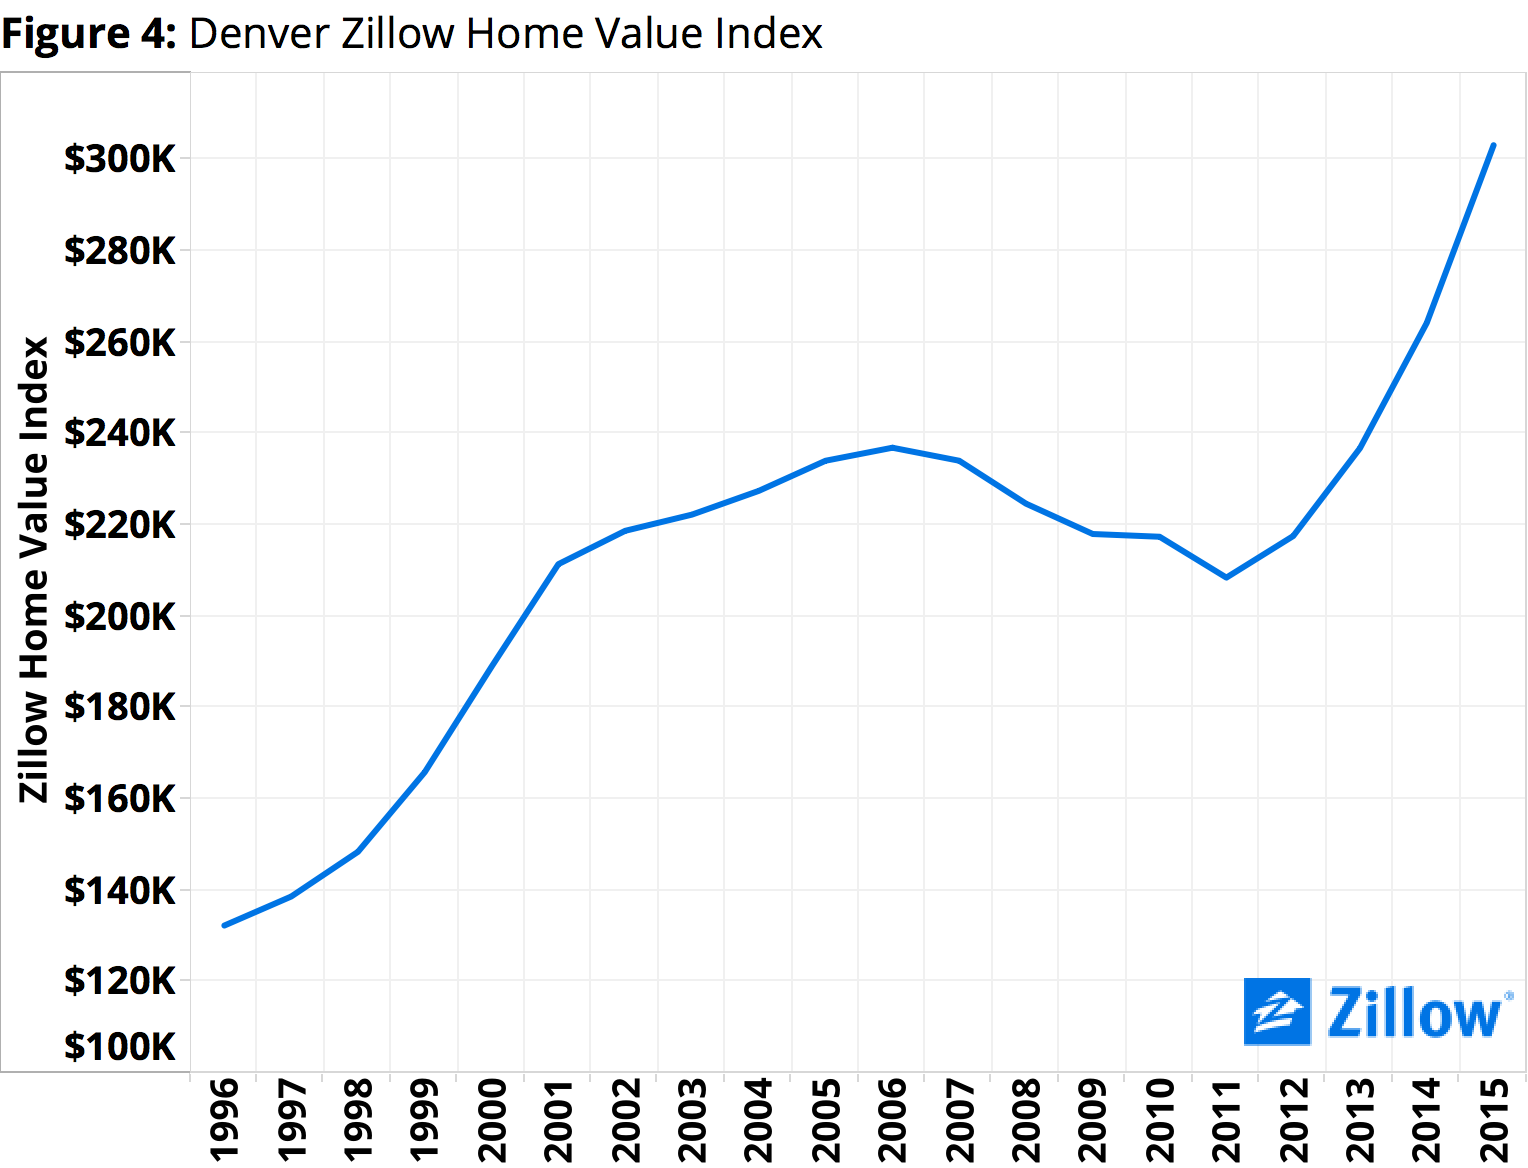
 Finally, a market like Denver is indicative of a market that quickly shook off the bust and has taken off like a rocket in recent years (figure 4). Prior to the recession, home values in the Denver area peaked at $237,600 in May 2006. During the bust, home values fell to a low of $207,300 by August 2011. By July of 2013, Denver-area home values had already surpassed their earlier peak, and haven’t slowed down since. Currently, home values in Denver stand at $326,300 – 37.3 percent higher than May 2006 values, and up a whopping 57.4 percent from their August 2011bottom.
This rapid growth in home values is largely driven by Denver’s own massive population growth over the past decade-plus, combined with a limited supply of new homes for sale. This kind of rapid and unflagging growth could be worrisome, and may indicate a local bubble starting to form in Denver and similar markets like the Bay Area. But even so, rapid growth on its own isn’t enough to indicate a bubble as long as this growth is driven by solid underlying economic fundamentals like strong job and wage growth, true housing demand and limited supply and not rampant speculation – which is the case in Denver.
So while taking a peek at peak home values naturally piques our interest and is useful in determining how far some markets have come and how far others still have to go, interpreting what it really means is all a matter of perspective.
44 Months of Annual Home Value Growth
In February, the median U.S. home value rose 0.2 percent from January and 4.3 percent from February 2015, according to the Zillow Home Value Index. U.S. home values have grown on a year-over-year basis for 44 straight months.
Home values in 26 of the nation’s 35 largest metro markets grew faster year-over-year than the nation’s 4.3 percent annual pace in February. Home values grew by more than 10 percent per year in six of those large metro markets: Denver (up 14.5 percent year-over-year), Dallas (13.7 percent), Portland (13.4 percent), San Jose (11.4 percent), San Francisco (10.9 percent) and Miami (10.5 percent). None of the nation’s largest metros experienced annual home value declines in February.
Rents: Not Hot in Cleveland
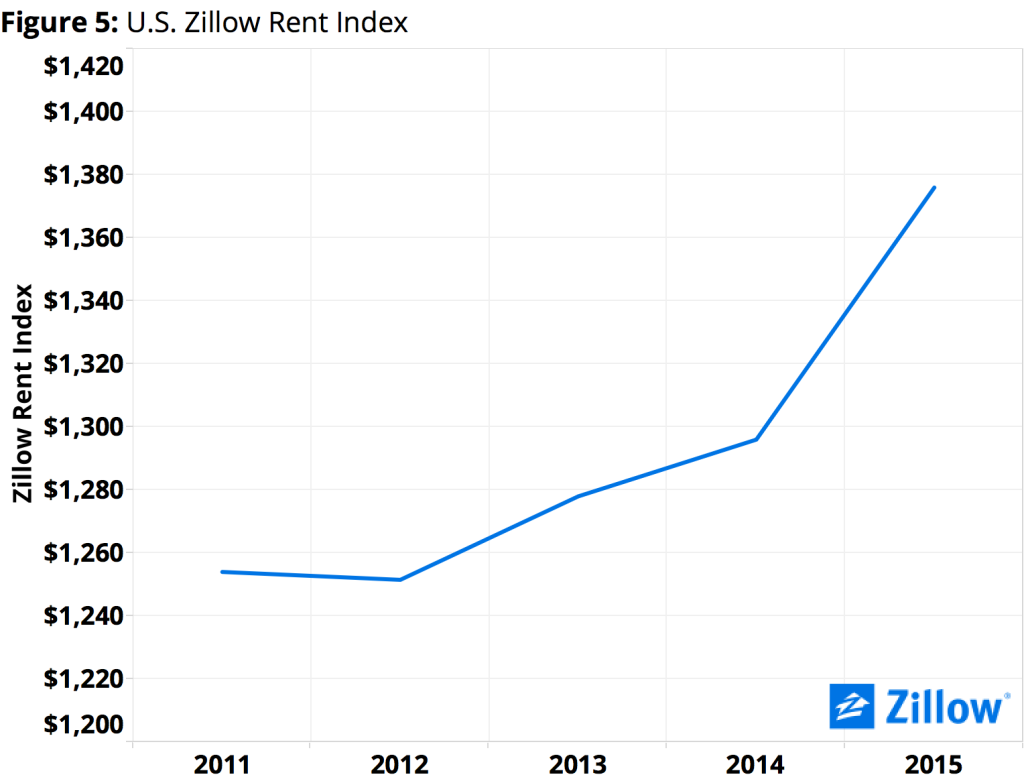 The U.S. median rent in January was $1,383 per month (figure 5), up 0.1 percent from January and 2.6 percent from February 2015, according to the Zillow Rent Index. U.S. rents have grown year-over-year for 42 consecutive months.
Median rents in all but one of the nation’s 35 largest metro markets grew year-over-year to some extent, with only Cleveland experiencing an annual decline (-1.2 percent from February 2015). Rents grew fastest year-over-year in the San Francisco (up 10.5 percent from January 2015), Portland (up 8.7 percent) and San Jose (up 8 percent) metros.
Outlook
Looking ahead, Zillow expects national home values to continue growing, rising another 2.3 percent through February 2017. Rents are also expected to keep growing over the next year, at a 1.7 percent pace through February 2017.
The new home value records being set in a number of markets mean we’re no longer making up ground lost during the housing recession –we’re laying a new path forward, based on demand for housing and economic growth throughout the economy. In some markets, these new highs are a return to normalcy, and in others are a reminder that not all markets react the same to broader economic trends.
Finally, the fact that many other markets are still off pre-recession peaks by double digits – places like Las Vegas (down 33.8 percent from Q2 2006 peaks) and Orlando (off by 29.5 percent from prior peaks) – may not even mean those markets are far from full recovery. Instead, their long path back just highlights how extraordinarily inflated home values were in those areas during the housing bubble.


