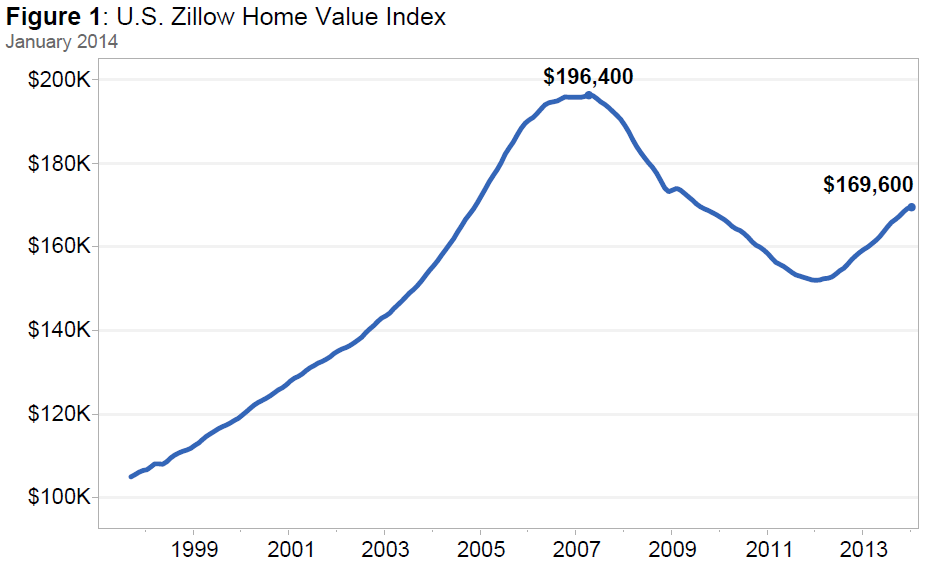
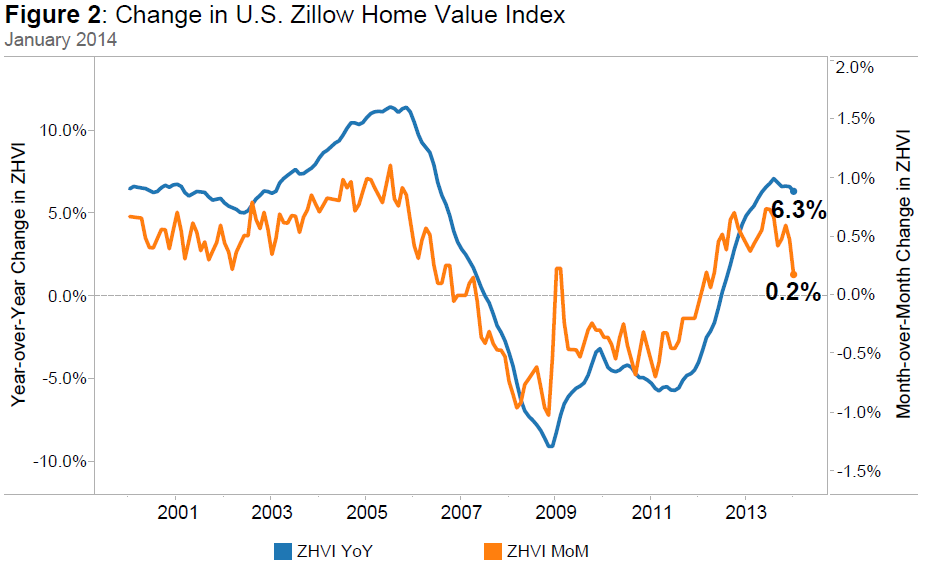
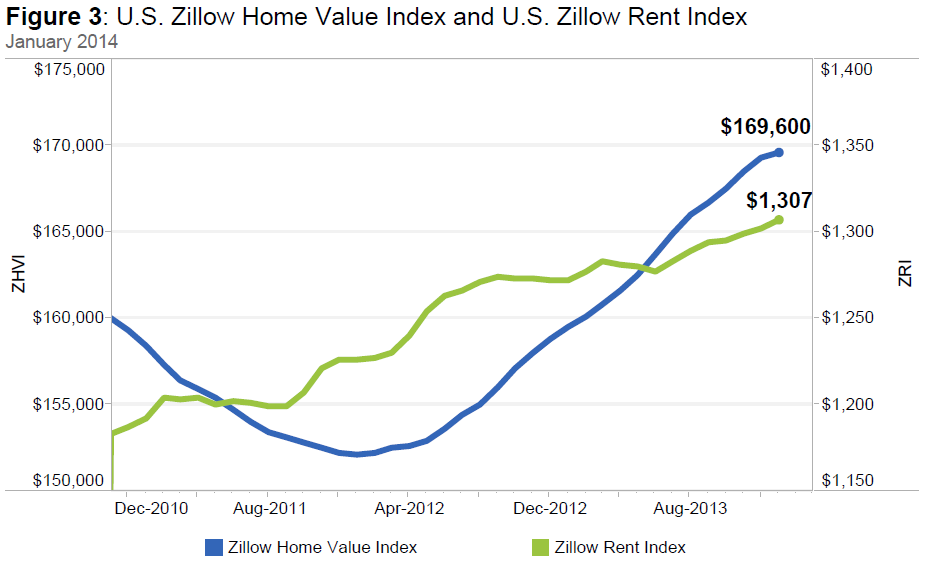
Zillow’s January Real Estate Market Reports, released today, show that national home values rose 0.2 percent from December 2013 to January 2014 to $169,600 (Figure 1). On a year-over-year basis, home values were up 6.3 percent (Figure 2) from January 2013. The last time national home values were at this level was in December 2004. Rents were up 2.8 percent on a year-over-year basis (Figure 3), as they continue their steady upward climb. The Zillow Home Value Forecast calls for 3.4 percent appreciation nationally from January 2014 to January 2015 – a marked slowdown from the 6.6 percent appreciation seen in 2013.
Many markets are experiencing above-normal rates of home value growth. Among the nation’s 35 largest metros, all but St. Louis experienced year-over-year home value increases in January. Those with the most notable annual increases in January include Riverside (27.3 percent), Las Vegas (26.9 percent), Sacramento (21.8 percent) and Detroit (20.0 percent).
But even as homes continue to appreciate in value, the rate at which those home values are growing has slowed markedly in many metros. The slowing in home value appreciation can in large part be attributed to increasing for-sale inventory levels. Inventory rose year-over-year in 22 of the nation’s 35 largest metro areas covered by Zillow, with the largest inventory gains coming in some of the areas that were hit hardest by the housing recession, including Las Vegas (up 42.8 percent), Phoenix (up 30.5 percent) and Sacramento (up 26 percent). With buyers having more homes to choose from and being less apt to engage in bidding wars, home value appreciation will continue to slow into 2014.
Home Values
The January Zillow Real Estate Market Reports cover 456 metropolitan and micropolitan areas. In January, 290 (63.6 percent) of the 456 markets showed monthly home value appreciation, and 385 (84.4 percent) of the 456 markets saw annual home value appreciation. Among the 35 largest metro areas covered by Zillow, four exhibited monthly depreciation in January. The biggest declines were in Phoenix (-0.5 percent), San Antonio (-0.4 percent) and Kansas City (-0.4 percent). Overall, national home values are still down 13.6 percent from their peak in April 2007.
Rents
The Zillow Rent Index (ZRI) covers 529 metropolitan and micropolitan areas and shows year-over-year gains for 391 metropolitan areas covered by the ZRI. Currently national rents are up 2.8 percent year-over-year. Large markets that saw extremely strong annual rent appreciation include Cincinnati (10 percent), Pittsburgh (10 percent), Seattle (8.2 percent) and Denver (8.1 percent). 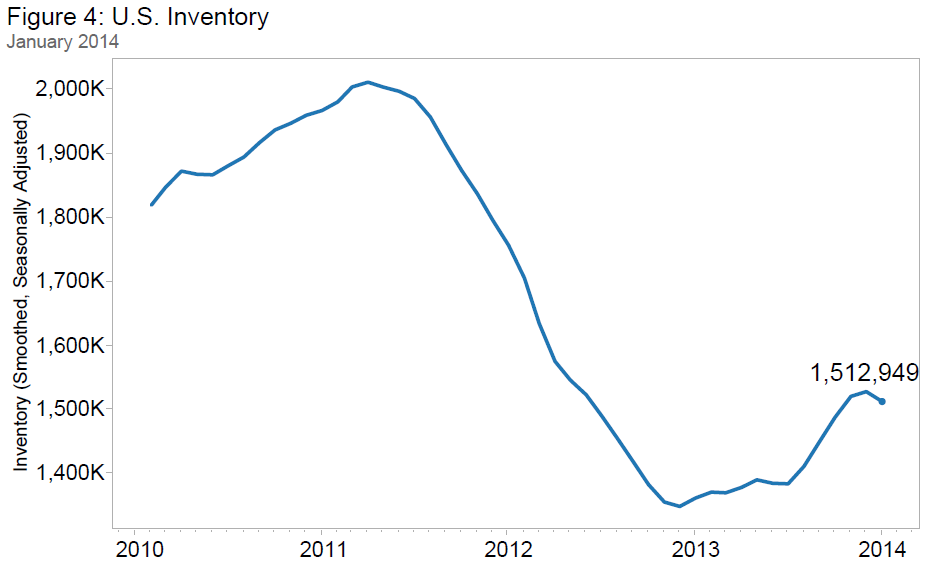
Inventory
Nationwide, the number of homes listed for sale on Zillow was up 11.1 percent annually in January on a seasonally adjusted basis, the fifth straight month in which inventory has risen year-over-year (see Figure 4). Inventory rose in 530 of the 648 metros Zillow covers with inventory data. Despite broadly increasing inventory levels, in most metros inventory is still not back to normal levels. As a result, we will still likely see bidding wars over what inventory is available in 2014, but probably much less than in 2013. 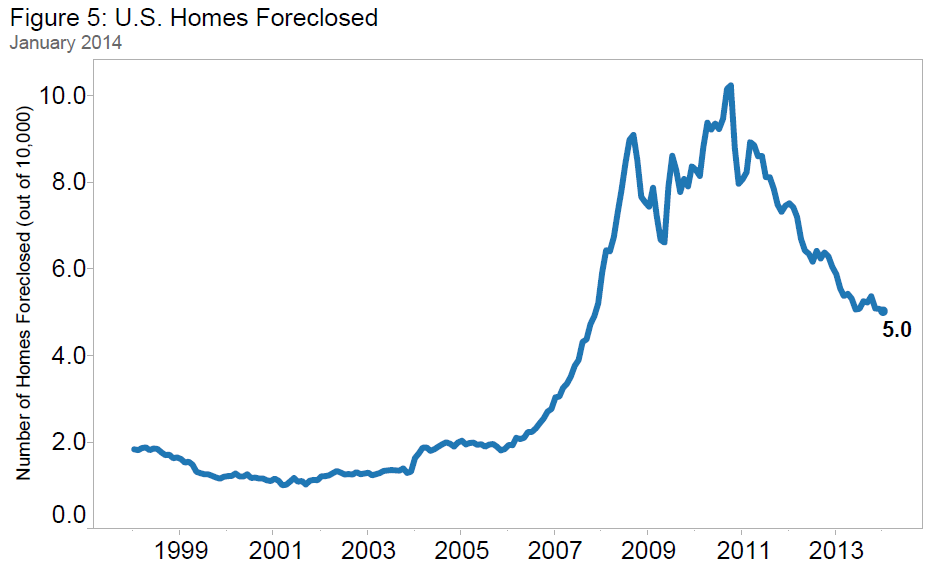
Foreclosures
The rate of homes foreclosed continued to decline in January, with 5.04 out of every 10,000 homes in the country being liquidated. The last time it was at this rate was in November 2007. Nationally, foreclosure re-sales also continued to fall, making up 10.4 percent of all sales in January (Figure 5). This is down 0.2 percentage points from January 2013. The foreclosure pipeline is slowly being cleared out; however, judicial foreclosure states, such as New York, New Jersey and Connecticut, are much slower in clearing the foreclosed home backlog.
Outlook
2014 has already started with slower appreciation, and even depreciation in some markets. Affordability will become an issue in some markets this year, and in fact, already is an issue in several markets, particularly on the west coast. As inventory levels continue to climb, appreciation rates will continue to ease – helping affordability, even though demand should continue to rise. One risk factor of slowing appreciation is the slowing reduction in negative equity, which is still relatively high in many metros across the U.S. Our forecast calls for another 3.4 percent appreciation from January 2014 to January 2015, which is more in line with historical appreciation rates. Still, 99 out of the 289 markets covered are forecasted to experience home value appreciation of 3 percent or higher over the next 12 months, showing that pockets of locally high appreciation will persist for a while.
To download data, please visit our data page.
