- The supply of homes for sale in the U.S. is 8.6 percent below its level a year ago.
- Markets in the West tend to favor sellers, while buyers have more negotiating power in the East.
- National home values rose 4.2 percent to $184,000, according to the January Real Estate Market Reports. Rents rose 2.9 percent to $1,381.
For months, the story in the national housing market has been about the differences in housing market performance in various local markets – some markets are super hot, some a little more sedate and some still struggling to recover – depending on local economic fundamentals. But if there’s one constant across almost every market nationwide, it’s low inventory.
And that lack of homes for sale could have big impacts as the market gears up for the busy spring shopping season.
The seasonally adjusted number of homes for sale nationwide fell 8.6 percent year-over-year in January, and has now fallen year-over-year in each of the past 12 months. Among the 35 largest metro markets, inventory fell year-over-year in January in all but four, and fell by 10 percent or more from last January in 16 of those 35 markets.
Even in those four metros where inventory improved in the past year – Houston, Washington, D.C., Atlanta and Pittsburgh – the number of homes for sale in each market is significantly below recent (admittedly somewhat inflated) peaks in inventory reached when the market bottomed in 2011 and into 2012 (figure 1).
Traditionally, when inventory is very low, builders will help fill the void with newly constructed homes. But housing starts reached a three-month low in January, indicating that newly built homes will not be a significant benefit for buyers in coming months. And a restricted supply of homes for sale will mean increased competition for those homes that are available, potentially leading to bidding wars that can price out entry-level or first-time buyers. Low inventory, along with a strong job market has been helping to drive up home prices, especially on the West Coast, tilting the balance in favor of sellers, at the expense of buyers.
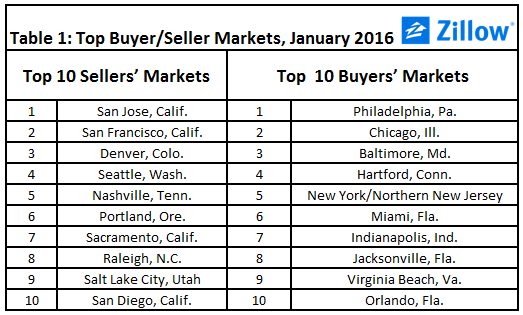 Besides inventory, Zillow looks at price cuts and days on market to help identify whether markets are better for buyers or sellers. According to Zillow’s latest Buyer/Seller analysis[i], markets that benefit sellers are mostly grouped in the West, where buyers are more likely to face bidding wars. Buyers will find themselves with more bargaining power in the East, in markets like Philadelphia and Baltimore (table 1).
Regardless if you’re looking for a home to buy or trying to sell, it’s important to know what kind of market you’re in. Hopeful buyers in a strong sellers’ market should be prepared to move quickly, since homes don’t stay on the market as long. In a buyers’ market, they can afford to take their time and be more selective. But low inventory is a factor affecting the majority of the country, so buyers should prepare for slim pickings as we enter the home buying season.
Home Value Growth: Slowly Picking Up
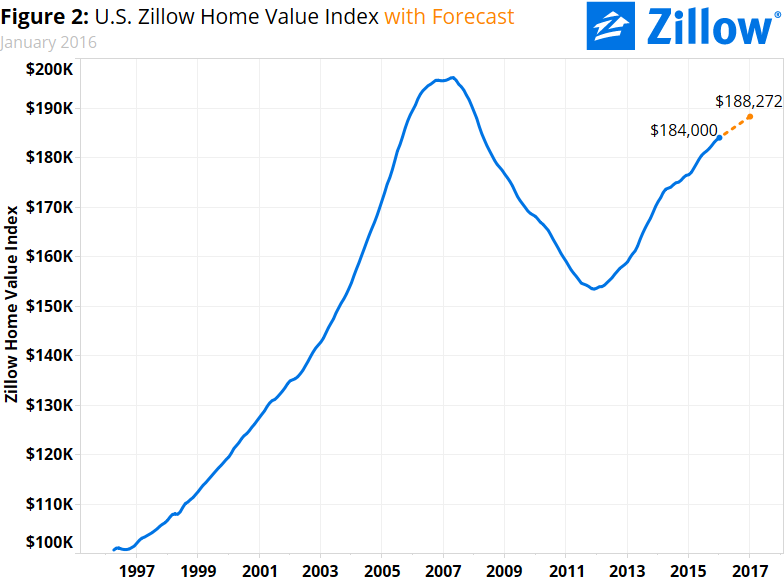 In January, the median U.S. home was worth $184,000, according to the Zillow Home Value Index, up 0.2 percent from December and 4.2 percent from January 2015 (figure 2). U.S. home values have grown on a year-over-year basis for 43 straight months. After falling to a 2.8 percent annual pace in March of 2015, the pace of annual home value growth nationwide has ticked up or remained steady from the prior month in each of the past 10 months.
Home values in 26 of the nation’s 35 largest metro markets grew faster year-over-year than the nation’s 4.2 percent annual pace in January. Home values grew by more than 10 percent per year in six of those large metro markets: Denver (up 15.4 percent year-over-year), Dallas (14.2 percent), San Jose (12.9 percent), Portland (12.8 percent), San Francisco (12 percent) and Miami (10.5 percent). None of the nation’s largest metros experienced annual home value declines in January.
Nationwide, home values remain 6.2 percent below their pre-recession, May 2007 peak of $196,100. But in 11 of the 35 largest metro markets, median home values have never been higher, having surpassed their recession-era peaks. These markets include: Pittsburgh, Charlotte, Columbus (Ohio), San Antonio, Houston, Austin, San Francisco, Portland (Oregon), San Jose, Dallas-Fort Worth and Denver. Median home values in the Boston area ($384,500 as of January) are a scant 0.1 percent below their September 2005 peak of $384,900.
Rental Growth: Slowly Cooling Off
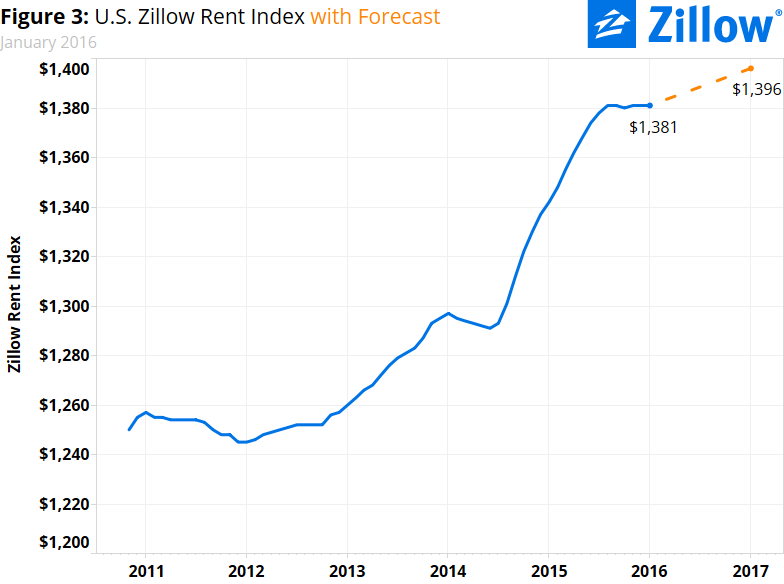 The U.S. median rent in January was $1,381 per month (figure 3), flat from December and up 2.9 percent from January 2015, according to the Zillow Rent Index. U.S. rents have grown year-over-year for 41 consecutive months, but have remained flat (or virtually flat[ii]) from the prior month for the past six months.
Median rents in all but one of the nation’s 35 largest metro markets grew year-over-year to some extent, with only Cleveland experiencing an annual decline (-0.6 percent from January 2015). Rents grew fastest year-over-year in the San Francisco (up 11.4 percent from January 2015), Portland (up 9.2 percent) and San Jose (up 8.3 percent) metros.
Outlook
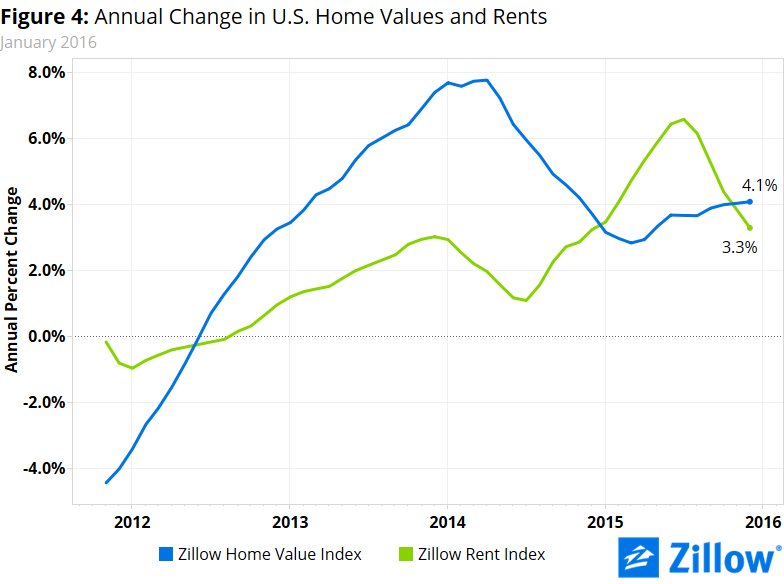
Beginning in late 2014, annual growth in rents began to outpace annual growth in home values, after years in which home values grew more quickly year-over-year. But the pattern flipped beginning in November and has continued into today, with the annual pace of home value growth overtaking the pace of rental growth (figure 4). Looking ahead one year, we expect this trend to continue, with home values expected to grow 2.3 percent through January 2017, according to the Zillow Home Value Forecast. Rents are expected to rise 1.1 percent over the same period, according to the Zillow Rent Forecast.
 The housing market is relatively stable right now, and should remain so, but there are a lot of economic factors happening behind the scenes that may have bigger impacts on housing as 2016 progresses. Low oil prices, for example, are weighing on growth and employment in states including the Dakotas, Alaska and Texas, softening rental appreciation and home value growth in those states’ most oil-dependent communities. And global economic volatility is contributing to both a strengthening U.S. dollar, which will impact demand from foreign buyers, and helping keep mortgage interest rates low.
For a number of reasons, housing policy may not be top of mind in this busy and important campaign year. But with a total value north of $28 trillion (and growing) the U.S. housing market is too big and too intertwined with the broader economy and with Americans’ day-to-day lives not to impact (and be impacted by) virtually every economic and social policy debate to some degree or another.
[i] Zillow’s Buyer/Seller Analysis ranked data on the number of days listings spent on Zillow and the percentage of homes on the market with a price cut, and ranked the 50 largest metro areas in the country to determine whether buyers or sellers have more negotiating power in a given market.
[ii] In October 2015, the Zillow Rent Index fell to $1,380 per month from $1,381 in September, before rising to $1,381 again in November.

