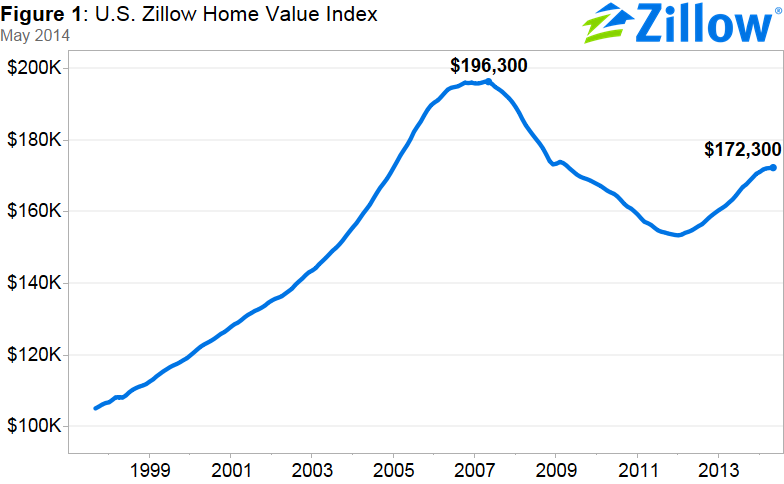
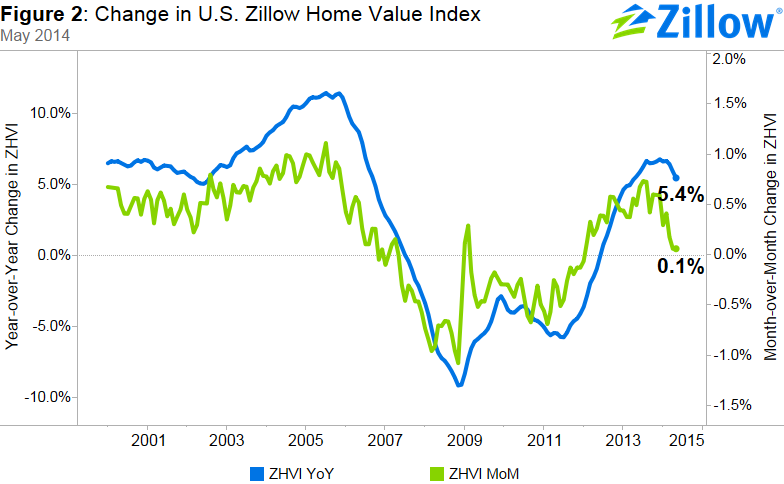
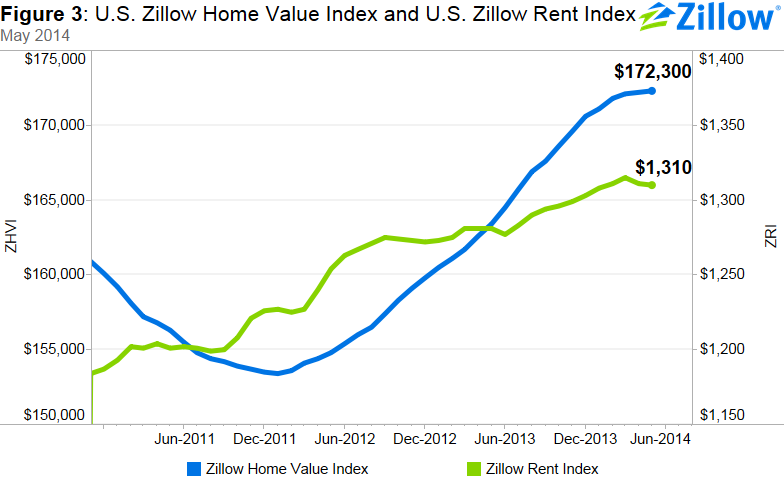
Zillow’s May Real Estate Market Reports show that national home values rose 0.1 percent in May 2014 from April 2014 to $172,300 (Figure 1). On a year-over-year basis, home values were up 5.4 percent (Figure 2) from May 2013. The last time national home values were at this level was in January 2005. Rents were up 2.3 percent on a year-over-year basis (Figure 3). The Zillow Home Value Forecast calls for 2.9 percent appreciation nationally from May 2014 to May 2015. This rate of appreciation is much more in line with historical appreciation rates and will be one of the moving parts that return the market back to more “normal” conditions.
While many markets are still experiencing above-normal rates of home value growth, a general slowdown in appreciation is evident. Among the nation’s 35 largest metros, all but Kansas City, St. Louis and San Antonio experienced year-over-year home value increases in May. Those with the most notable annual increases include Las Vegas (23.3 percent), Riverside (21.9 percent), Detroit (17.3 percent) and Atlanta (16.4 percent).
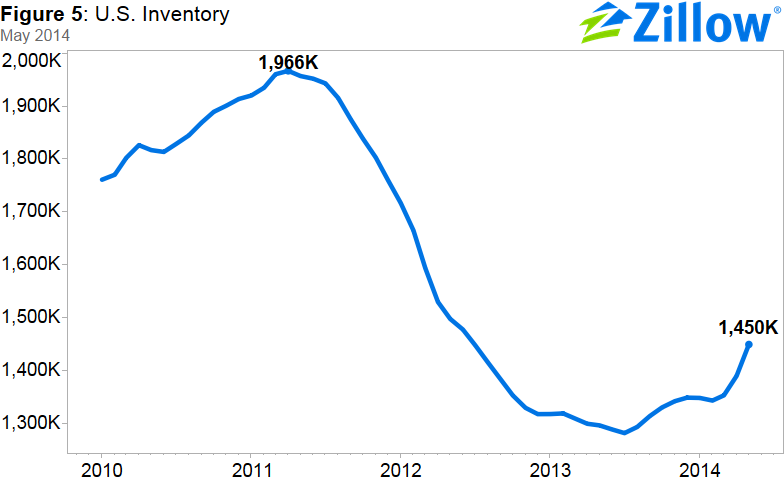
In May, U.S. inventory of for-sale homes grew year-over-year by 11.8 percent. More than 500 of 648 metros experienced an increase in inventory levels on an annual basis. Despite rising inventory, overall levels still remain very low. Nationally, inventory is down 26% from its peak in April 2011. In many metros, the inventory shortages are driven by fewer homes for sale in the bottom third of the market by value (Figure 6).
Home Values
The May Zillow Real Estate Market Reports cover 514 metropolitan and micropolitan areas. In May, 296 (58 percent) of the 514 markets showed monthly home value appreciation, and 406 (79 percent) saw annual home value appreciation. Among the 35 largest metro areas covered by Zillow, 11 exhibited monthly depreciation and one (Denver) was flat in May. The biggest declines were in Houston (-1.5 percent) and San Antonio (-1.5 percent). Overall, national home values are still down 12.2 percent from their peak in May 2007.
Rents
The Zillow Rent Index (ZRI) covers 856 metropolitan and micropolitan areas and shows year-over-year gains for 622 metropolitan areas covered by the ZRI. Currently, national rents are up 2.3 percent year-over-year. Large markets that saw extremely strong annual rent appreciation include San Jose (11.3 percent), San Francisco (8.9 percent), Austin (7.9 percent) and Denver (6.9 percent).
Foreclosure
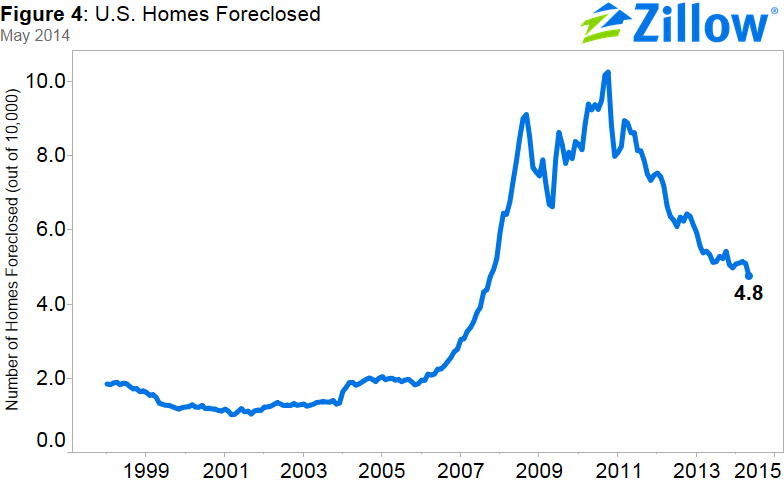
The rate of homes foreclosed continued to decline in May, with 4.8 out of every 10,000 homes in the country being liquidated. The last time it was at this rate was in November 2011. Nationally, foreclosure re-sales also continued to fall, making up 8.8 percent of all sales in May (Figure 4), compared to 9.5 percent in April. As we return to more normal market conditions, we expect the share of the distressed market to keep declining as well. Fewer homes will be foreclosed upon in a rising home value environment, which also means that fewer exit the foreclosure pipeline as foreclosure re-sales months or years down the road. Therefore price pressures of distressed sales on the non-distressed market will continue to fade over time.
Inventory
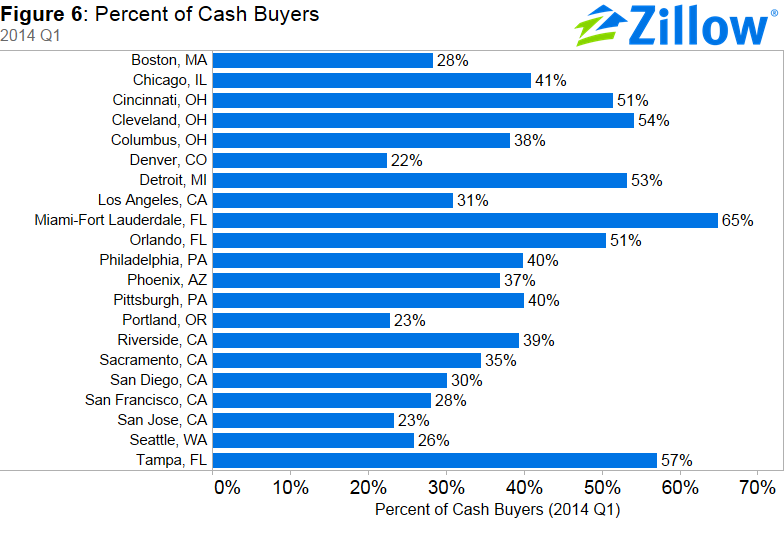
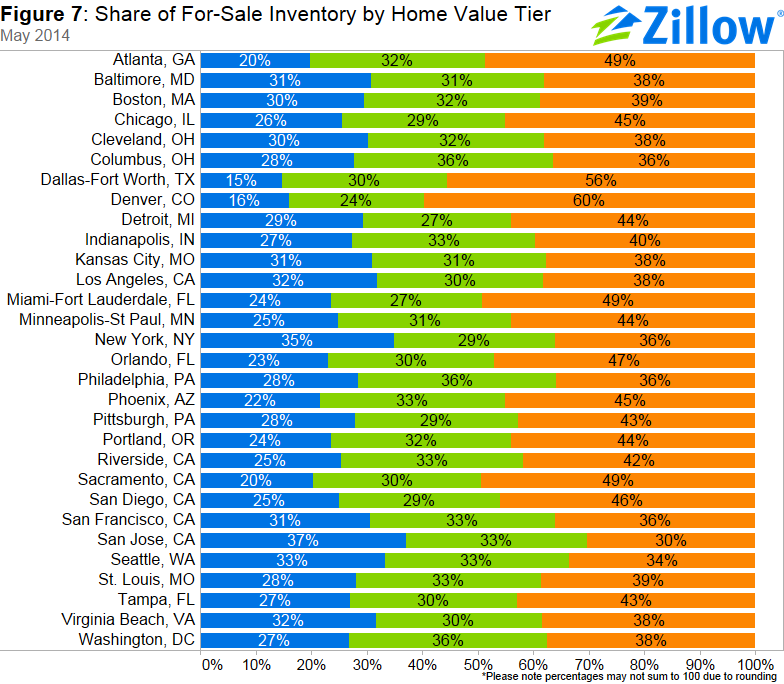
Nationwide, the number of homes listed for sale on Zillow was up 11.8 percent annually in May on a seasonally adjusted basis, the third straight month in which inventory has increased (see Figure 5). Inventory rose on an annual basis in almost 80 percent of metros covered by Zillow. Despite the annual increases in inventory, in most metros inventory is still not back to normal levels. Tight inventory is especially pronounced in the lower end of the market, which we define as the bottom third of the housing stock. For example, only 15 percent of the inventory available for sale in Dallas-Fort Worth right now comes from the bottom third of the housing stock by value, whereas 60 percent of homes available for purchase are top-tier homes. Of the largest metros, most saw very few for-sale homes come from the bottom tier, and more so from the top tier (Figure 7). This tightness of supply will continue to impact first-time home buyers and others trying to buy a lower-end home. Bidding wars will continue well into 2014, in part driven by the still relatively high share of cash buyers in many markets (Figure 6). In many of the metros, cash buyers are especially prevalent in the bottom tier of the market. Therefore, not only supply is tight, but demand is also high for these types of homes. Investors have been quite active in buying up homes and converting them into rental units.
Outlook
In this somewhat uneven housing recovery, we are well on our way to return to more “normal” rates of home value appreciation. Our forecast calls for another 2.9 percent appreciation from May 2014 to May 2015, roughly in line with historical appreciation rates. However, other factors still remain skewed in this recovery and most likely will remain so for a few more years. Negative equity rates remain high, with 18.8 percent of mortgaged homeowners nationwide underwater. Negative equity is especially focused among the least expensive homes, which is having an adverse effect on inventory in the bottom tier. Therefore inventory remains too low, which is one of the factors impacting existing home sales. Household formation is still relatively low and we currently see more households being formed on the rental side. Some markets are also seeing affordability issues, as home value appreciation still remains high in many west coast markets without enough income growth. Luckily, slowing home value appreciation and future employment and income growth will help in staving off future housing affordability issues in much of the nation.
