Even as Home Values Rise, Negative Equity Rate Flattens
When something is “flat,” that tends to mean it’s pretty boring. Unless we’re talking about negative equity.
In the fourth quarter of 2014, the U.S. negative equity rate – the percentage of all homeowners with a mortgage that are underwater, owing more on their home than it is worth – stood at 16.9 percent, unchanged from the third quarter. Negative equity had fallen quarter-over-quarter for ten straight quarters, or two-and-a-half years, prior to flattening out between Q3 and Q4 of last year.
While this may not seem very notable (after all, overall negative equity didn’t go up, merely flattened out), this represents a major turning point in the housing market. The days in which rapid and fairly uniform home value appreciation contributed to steep drops in negative equity are behind us, and a new normal has arrived. Negative equity, while it may still fall in fits and spurts, is decidedly here to stay, and will impact the market for years to come.
In fact, some homeowners trapped very deeply underwater may essentially be in negative equity forever. And those homeowners are much more likely to own America’s least expensive homes. Making matters worse, many homeowners in the bottom home value tiers are not only underwater, but very far underwater. Consider, for example, homeowners of the least expensive homes in the Detroit metro area. These homeowners are 29 times more likely to owe twice as much than their house is worth compared to a homeowner at the high end of the market. The following interactive graphic shows the loan-to-value distributions for homeowners across the three home value tiers for the largest 100 metro areas.
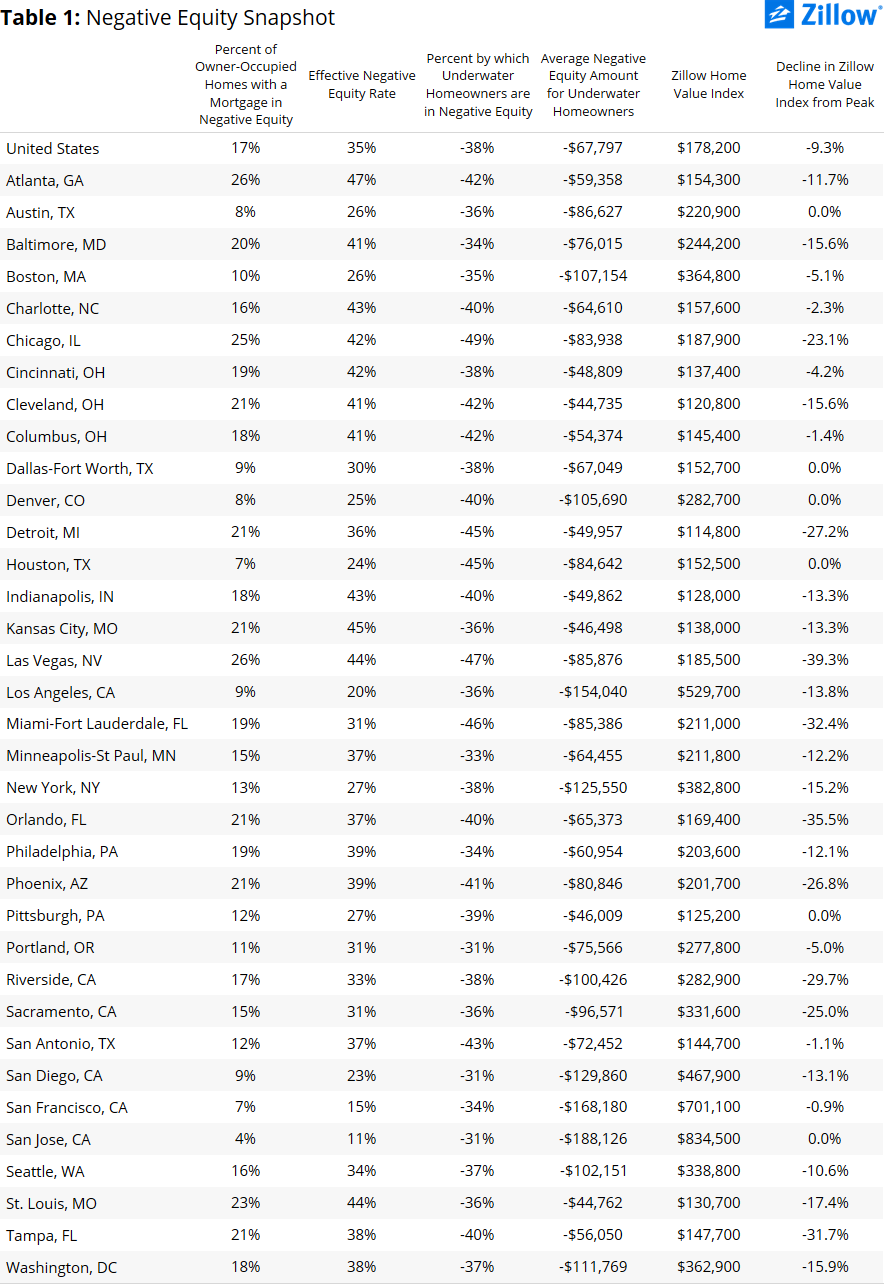
Negative equity is not an equal-opportunity predator, and looms larger over less expensive homes. Nationwide, 27.3 percent of homeowners with a mortgage in the bottom one-third of homes by value were underwater in the fourth quarter. The negative equity rate among top-tier homeowners was 9.1 percent. In some areas, this gap was even more distinct. In Atlanta, for example, 49 percent of homes in the bottom-third of home values are in negative equity, compared to 11 percent of mortgaged homes in the highest-valued third.
This flattening out of the negative equity rate comes even as home values overall continue to rise, albeit at a slower pace than in previous years. Rising home values generally contribute to negative equity declines. U.S. home values are expected to grow by about 3 percent this year, a healthy rate in most normal markets. But for homeowners that are, say, roughly 20 percent underwater, home value growth of 3 percent per year means it could take seven years or more to reach positive equity, assuming the homeowner only pays off the interest on their mortgage each month. For homeowners that owe 50 percent more than their home is worth or even double the amount their home is worth, home value appreciation alone will be insufficient to pull them into positive territory in the next ten years. Short sales and foreclosures seem to be the only option to clearing high negative equity from the books.
And even as home values rise, this rising tide isn’t lifting all boats. While home values overall may be up, many individual homes aren’t rising as quickly, or are even falling in value. And those homes most likely to be falling in value are generally located in the lowest tier of homes which are typically inexpensive, tract-built homes located far from urban centers.
This compounds the problem even further. We know that millions of current renters and younger millennials would like to buy in coming years, contributing to an overall upswing in demand for housing. But the very homes they’re most likely to buy – the kinds of farther-flung, inexpensive homes that attracted their older brothers and sisters a decade ago – are the exact homes most likely to be stuck in negative equity, and off the market.
As a result, it’s likely that in areas with high negative equity and low inventory of affordable homes for sale, competition will remain fierce for those homes that are available. This will contribute to localized bidding wars and price spikes that only serve to make these homes more unattainable for the kind of buyers that want and need them most.
While the market waits years for simple home value appreciation to help solve the problem, the only viable short and medium-term solution is for builders to step in and fill the void by constructing more lower-priced homes to help meet growing demand. Except thus far, builders have largely been unwilling to build these kinds of homes, instead focusing on the more profitable higher end of the scale.
As negative equity appears set to dig in and remain an entrenched part of the landscape, much depends on builders’ flexibility if the market is to adequately respond to the needs of millions of younger and lower-income buyers.
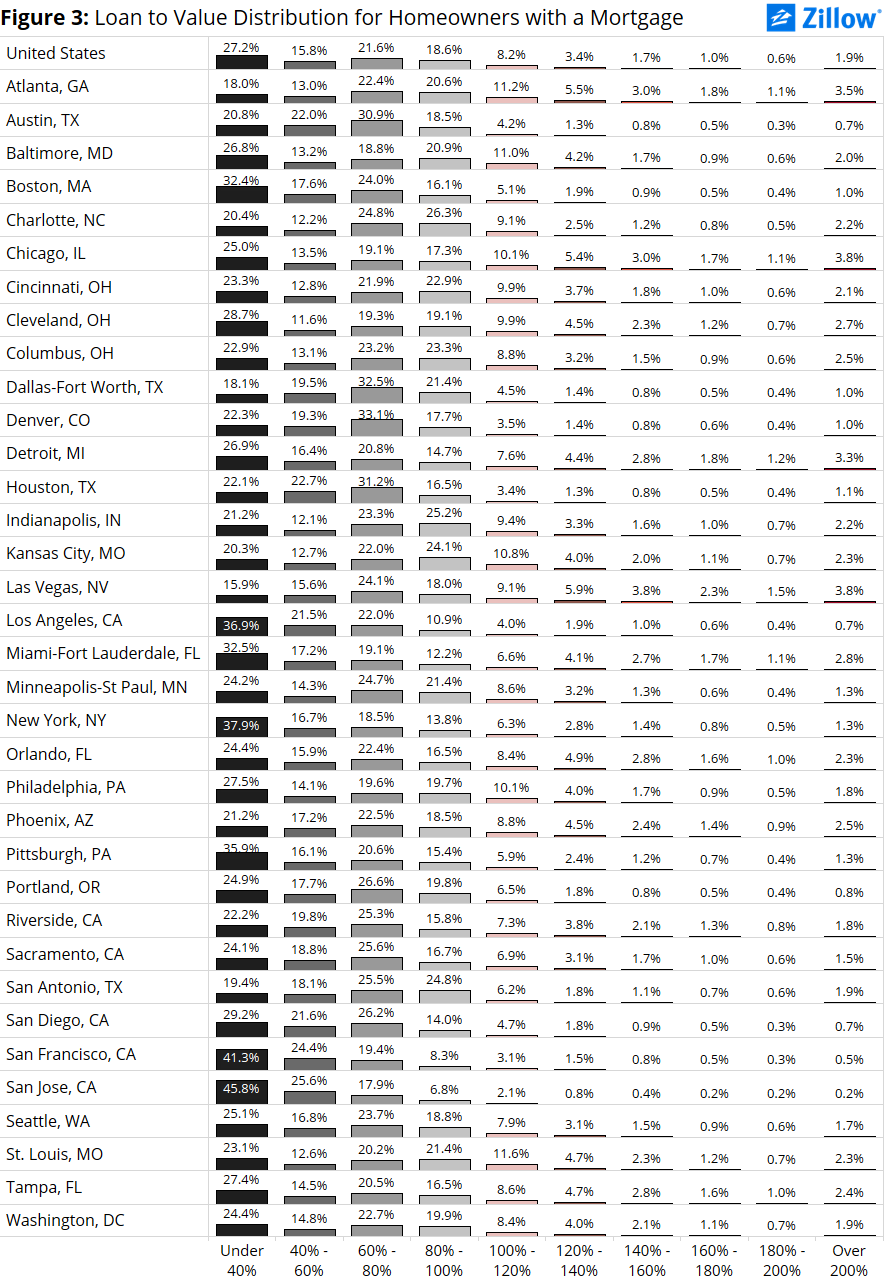
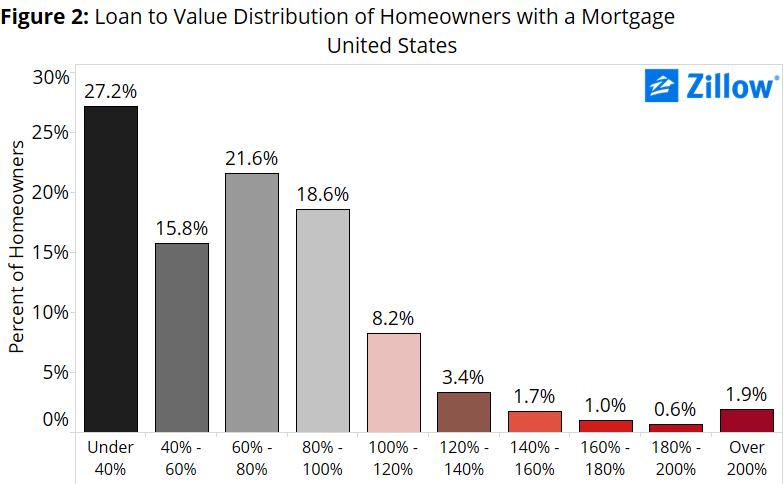 Nationally, of the homeowners who are underwater, around half are only underwater by 20 percent or less, which is to say they are close to escaping negative equity. (Figure 2) On the other hand, 1.9 percent of all owners with a mortgage remain deeply underwater, owing at least twice what their home is worth. Of the largest metro areas, markets with above average rates of deeply underwater homeowners include Las Vegas (3.8 percent), Chicago (3.8 percent), Atlanta (3.5 percent), Detroit (3.3 percent) and Miami (2.8 percent) (Figure 3).
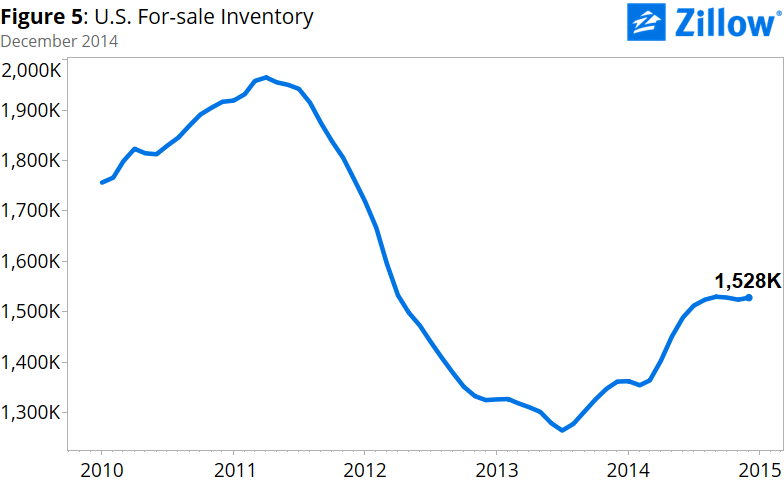
Unfortunately, homeowners of lower-end homes are not only more likely to be underwater, but are also more likely to be deeply underwater. The bulk of negative equity has accumulated in the bottom one-third of homes by home value (Figure 4). In most markets, this has led to especially tight inventory conditions among lower-valued homes, since underwater homeowners find it virtually impossible to list their home for sale without undergoing a lengthy short-sale process or bringing cash to the closing table. These shortages of for-sale homes were readily apparent in 2013 and 2014, and continue to be an issue for millennials and first-time homebuyers looking to purchase an entry-level home. Although the current overall inventory level is higher than a year ago (Figure 5), we are still far below peak levels of for-sale inventory.
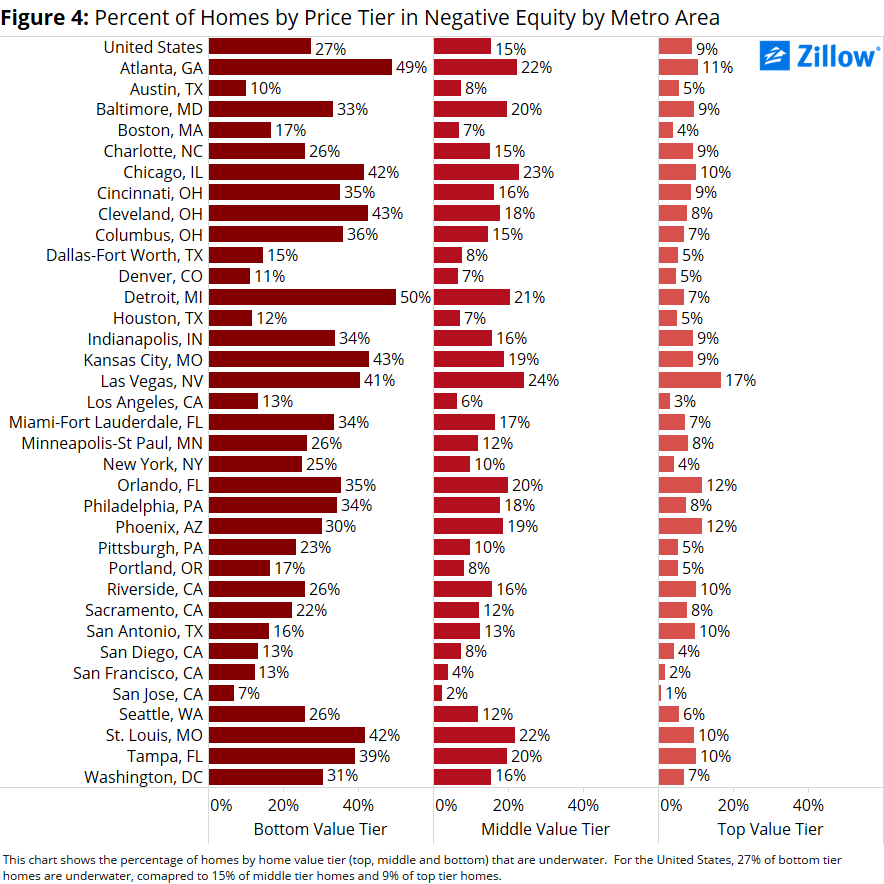
 In the fourth quarter, 27.3 percent of bottom-tier homes were in negative equity, compared to 15.4 percent of middle-tier homes and 9.1 percent of top-tier homes. In Detroit, for example, 50.2 percent of homes valued in the bottom tier were underwater, while just 7.0 percent of the area’s top-tier homes with mortgages were underwater. Of all homeowners with a mortgage, 21.3 percent are underwater in Detroit. Atlanta is another metro area with many underwater bottom tier homes. 49.0 percent of bottom-tier homeowners in Atlanta are underwater, yet the metric for the top-tier is 10.7 percent. Regardless of home values, 26.1 percent of homeowners in Atlanta are underwater. Some markets have now started to even increase their share of negative equity homeowners in the bottom-tier over time. Philadelphia, Detroit, St. Louis and Chicago are just a few of the metros that have seen an actual increase in the number of bottom-tier homeowners that are underwater. This is due to decreasing home values among the lowest valued homes in those markets.
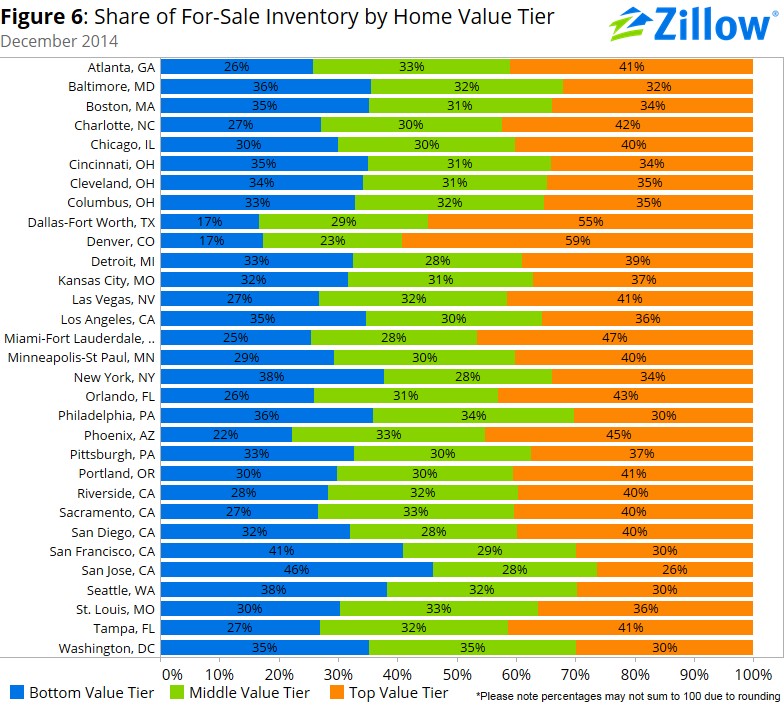
Figure 6 shows the share of for-sale inventory across the different price tiers for December2014 for the largest 35 metro areas, with many showing low levels on inventory in the bottom tier, and higher shares of inventory in the top tier.
Going forward, even increases in low-end home values might not make a dent as these homeowners also tend to be very deeply in negative equity. Homeowners in the bottom tier are much more likely to skew to the right of the LTV distribution and hold more negative equity in their homes than middle and top tier homeowners.
While the national negative equity rate is 16.9 percent, at the metro level there is wide variation in the rate of negative equity, with the percentage of underwater borrowers ranging from 2 percent to 51 percent. Among large metros, Virginia Beach (28.3 percent), Jacksonville (27.0 percent), Las Vegas (26.4 percent), and Atlanta (26.1 percent) had the highest rates of negative equity. Furthermore, there is wide variation in how deeply homeowners are underwater. Figure 3 provides an overview of the distribution of the loan-to-value ratio for the largest metropolitan areas (a loan-to-value ratio greater than 100 percent means that the homeowner is underwater).
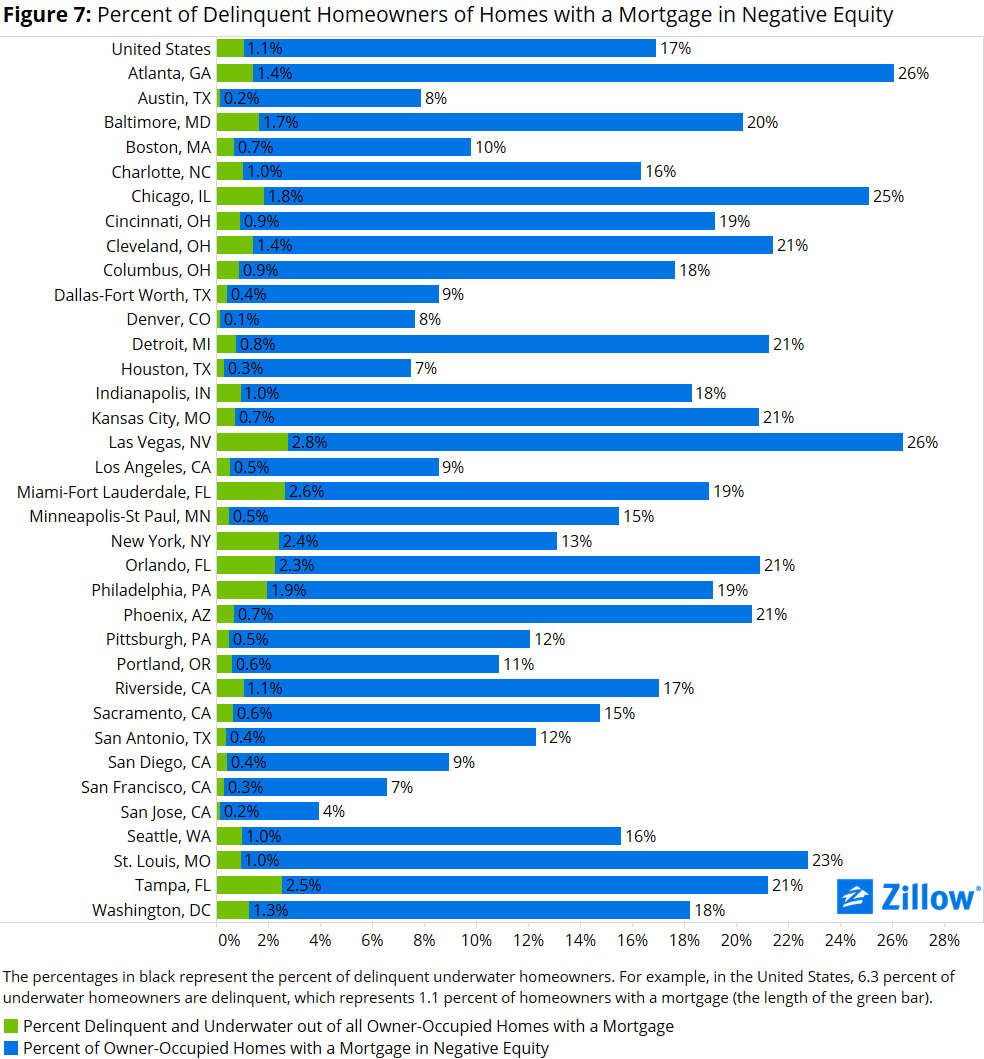
While negative equity makes a household more vulnerable to foreclosure, most homeowners in negative equity will not end up in default. The majority of underwater homeowners continue to make regular payments on their mortgages, with only 6.3 percent of underwater homeowners being delinquent. This implies that 1.1 percent of all homeowners with a mortgage are at high risk for foreclosure near-term. Figure 7 shows a breakdown of these numbers for the top 35 metros.
Negative equity continues to adversely affect the U.S. housing market, and will for the foreseeable future. We have now entered the “new normal” where negative equity rates are no longer declining in large steps as they have been in previous quarters across the Unites States. While millions of previously underwater homeowners have been freed in recent year thanks to rapid home value growth, those that remain underwater are both more deeply underwater than others and likely own the kinds of inexpensive, bottom-tier homes that are unlikely to appreciate in value very quickly and may even depreciate. Nationally, 51 percent of underwater homeowners owe at least 20 percent more than their homes’ value on their mortgage, with just under two percent owing twice what their home is worth. The bottom of the market is also where a lot of demand has been focused and is expected to be focused going forward. A lack of inventory because of high rates of negative equity will create competition among entry-level buyers and help drive up prices on those homes that are available. Some of this pressure could be alleviated by newly constructed, relatively inexpensive homes, but so far, builders have been unwilling or unable to enter the bottom half of the market. And if and when they do decide to shift their focus, new homes will not come on line overnight.
Our forecast calls for the rate of negative equity to drop from its current value of 16.9 percent to 15.1 percent by the end of the fourth quarter of 2015.
