Lack of New Homes Helping Drive New Construction Prices to Record Highs
Anemic new home construction activity in the wake of the housing bust is doing more than constricting overall inventory of homes for sale – it’s also helping push up both the price of those new homes that are built and the overall age of homes that do sell.
- The number of new homes built each year has steadily climbed, but is still well below historical norms
- The new construction market share of single-family home sales has fallen dramatically since the housing collapse
- Buyer competitiveness for the limited supply of new homes has caused the premiums on newly built homes to reach record levels
Anemic new home construction activity in the wake of the housing bust is doing more than constricting overall inventory of homes for sale – it’s also helping push up both the price of those new homes that are built and the overall age of homes that do sell.
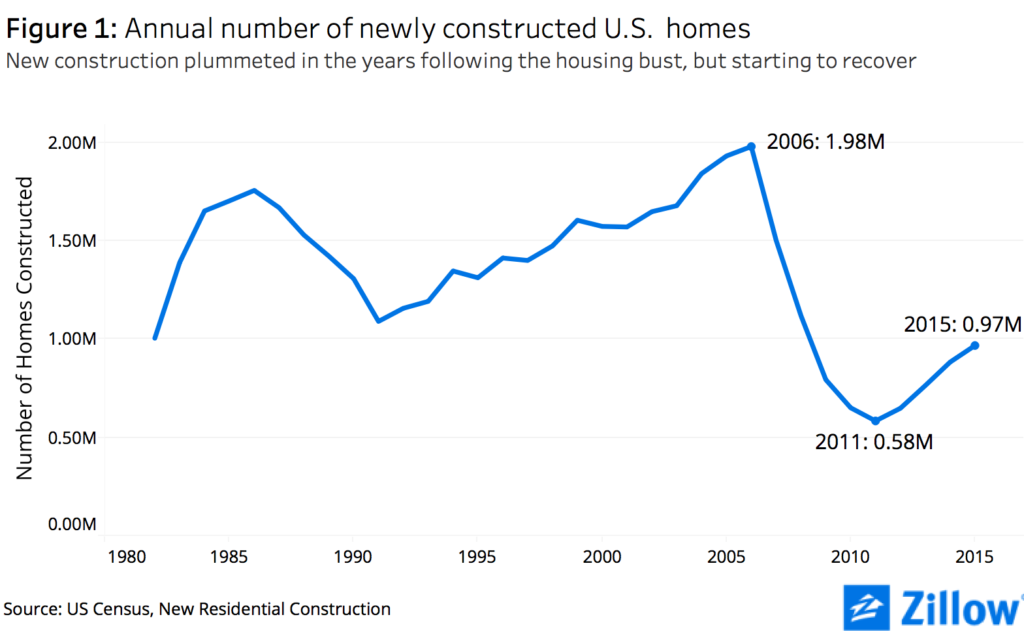 The number of new housing starts fell off a cliff following the housing collapse, from almost 2 million completed homes in 2006 to just 600,000 by 2011 (figure 1). And while the number of new homes constructed nationwide has grown in each year since bottoming out, we are still below the historical average of about 1.5 million new homes built per year.
As a result, the total market share commanded by newly constructed homes has dwindled. Between 2005 and 2007, new construction accounted for 13 percent of single-family home sales. Today, the rate is less than half that – just 6.2 percent (figure 2). Generally, markets that experienced the biggest growth in housing construction during the boom years also experienced the biggest declines during the bust. Between 2005 and 2007, new construction accounted for about 1 in 4 single-family homes sold in Orlando, Jacksonville and Las Vegas. Between 2012 and 2014, new construction’s market share fell to about 10 percent in each of these three markets.
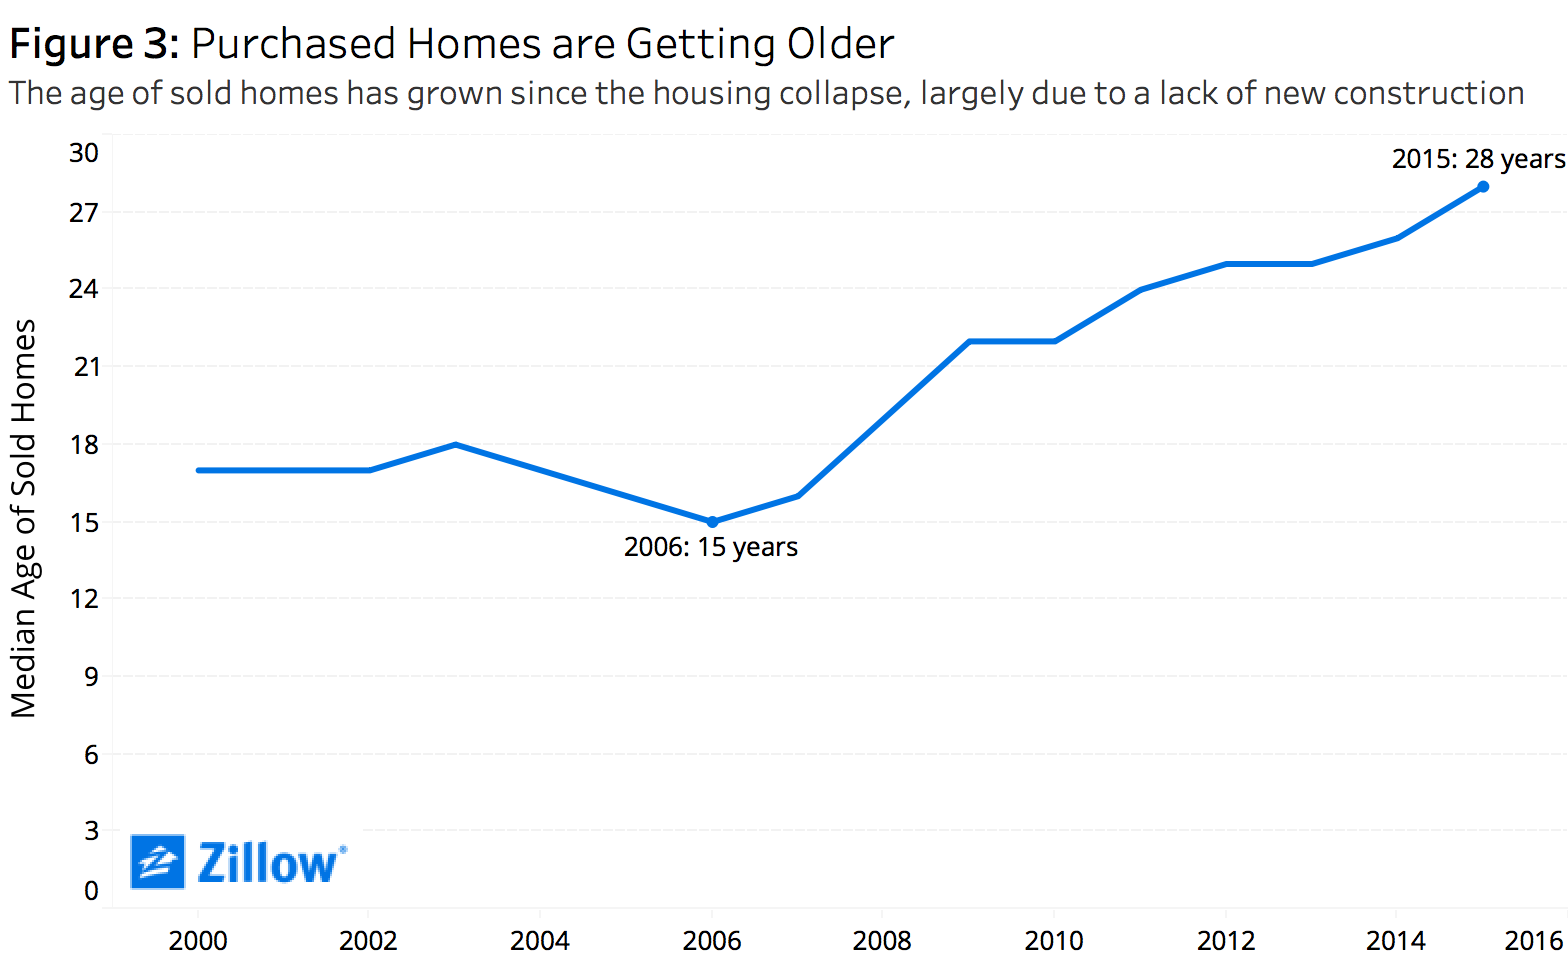
This lack of new construction has long-term ramifications. The age of the average home sold each year has risen substantially since the housing collapse. In 2006, the average home sold nationwide was about 15 years old. By 2015, the average home sold in the U.S. was 28 years old (figure 3).
 Immediately following the housing collapse, a lack of new construction wasn’t a primary concern – getting consumers back into the market and buying homes again, any homes, certainly was. But in subsequent years, as the general economy turned around and housing demand picked back up, the housing market has felt the effects of limited supply of new homes. The knee-jerk reaction, then, is to simply demand builders build more homes – and they’re certainly trying. The problem is it takes years to plan, permit and build new homes, especially on the kind of scale needed to make a meaningful dent in the nation’s inventory shortage. So there’s a response lag between the signal to builders of a strong economy and the eventual ribbon-cutting on new homes.
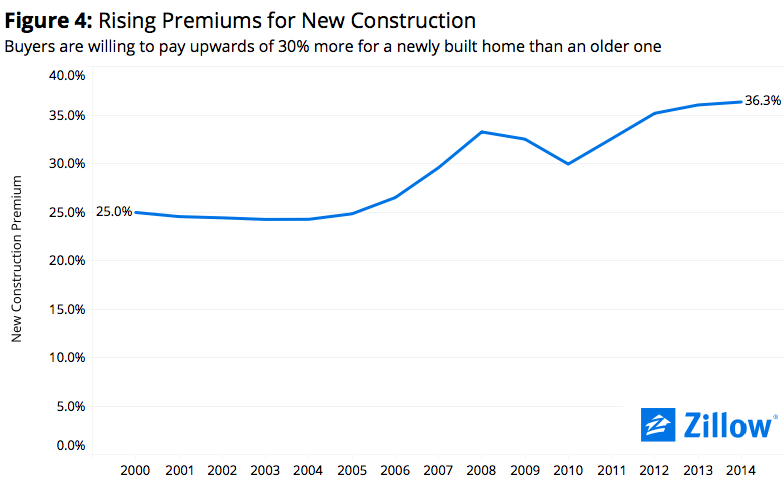 Compounding the problem: Even as builders have struggled to catch up, demand has remained at a boil, creating competition and pushing up prices for those new homes that are available. And this escalation in prices overall has led to a growing premium between the price of a new home and the price of an existing home. New homes have always been more expensive, but the gap has only widened in the face of this supply/demand imbalance. In the lead-up to the bubble, home buyers valued newly built homes about 25 percent more than the average home in a given ZIP code. In recent years, this premium has risen to more than 35 percent (figure 4).[1]
This broad national trend is also true across a clear majority of the largest metros. In most of the largest metros analyzed,[2] the premium for new construction was higher between 2012 and 2014 than during the bubble. This is especially true in those three markets mentioned earlier (Orlando, Jacksonville, and Vegas), where new construction market share has fallen considerably.
According to the Zillow Group Report on Consumer Housing Trends, almost half of all home buyers nationwide in the past year (48 percent) considered new construction. But as our research shows, very few home buyers actually end their home search with the keys to a newly built home.
The good news is that the trend in new construction volume looks to be returning to more normal levels, however slowly, which should help alleviate price pressures. But in the meantime, be prepared to pony up for a newly built home, or settle for an older, existing one.
[1] For every year between 2000 and 2014, we computed the median Zestimate of newly built single-family homes by ZIP code (the Zestimate model accounts for the age of homes). We then calculated a ratio of each ZIP code’s median new construction value to the median value of all single-family homes, to estimate how much more valuable new construction is. We then aggregated this data to the national and metro level, to estimate the premium homebuyers placed on new construction, controlling for location.
[2] Limited only to metros in which we have sufficient new construction data.


