Key Takeaways From the October Existing Home Sales Report
Seemingly every month for the past year, a strong jump in existing home sales has been followed by a strong decline, and then vice versa the next month.

Seemingly every month for the past year, a strong jump in existing home sales has been followed by a strong decline, and then vice versa the next month.
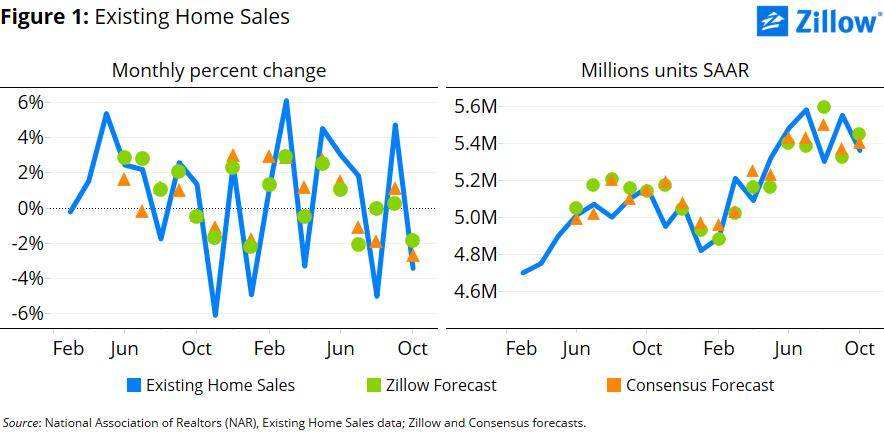
Sir Issac Newton didn’t write much about real estate, but for much of the past year it has seemed like existing home sales have been governed by the esteemed British physicist’s Third Law of Motion: For every action, there is an equal and opposite reaction. Seemingly every month for the past year, a strong jump in existing home sales has been followed by a strong decline, and then vice versa the next month.
Existing home sales retreated 3.4 percent from September to October, to 5.36 million units at a seasonally adjusted annual rate (SAAR), according to the National Association of Realtors – partially erasing the 4.7 percent monthly increase recorded in September (figure 1). The decline puts existing home sales roughly in line with where they stood in August, and also roughly where they stood in May before a sequence of jumps and declines. Year-over-year, U.S. existing home sales were up 3.9 percent in October, the smallest annual gain in 10 months.
 Single-family home sales dropped more (-3.7 percent) in October from September than condo/co-op sales (-1.6 percent). But single-family sales year-over-year are up 4.6 percent, while condo/co-op sales are down 1.6 percent. October marked the first year-over-year drop for condo/coop sales since February. Single-family home sales have not experienced a year-over-year decline since September 2014.
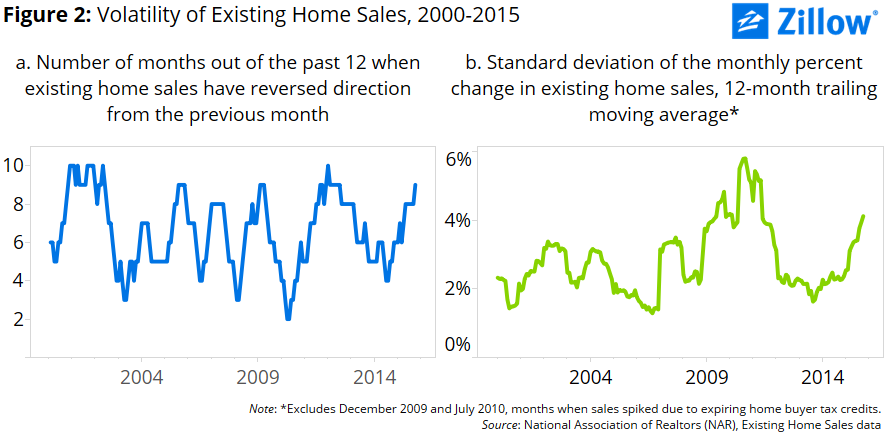
Existing home sales have been particularly volatile over the past year. In nine of the past 12 months, home sales have reversed direction from the previous month (figure 2a) – an increase in existing home sales is followed by a decrease, or vice versa. This level of volatility has only been exceeded once in the past decade, and only equaled on 14 other occasions (or in 12 percent of all months since November 2005).
Another way to look at the volatility in existing home sales is to consider the standard deviation of the month-over-month percent change in sales –essentially, how far away from the average monthly percent change each month’s data has gotten. The trailing 12-month moving average of the standard deviation of the month-over-month change in existing home sales is now higher than it has ever been outside of the recent recession (figure 2b).
 The median seasonally-adjusted price of existing homes sold continued its upward march, rising 0.4 percent to $222,700 in October, up 5.8 percent from a year earlier. The median price of single-family homes sold increased more strongly – by 0.7 percent to $224,800 – while the median price of condos/co-ops sold fell slightly, down 0.1 percent to $209,400. Year-over-year, the median sales price of existing homes sold is up 5.8 percent, compared to 6.4 percent for existing single-family homes and 1.5 percent for existing condos/co-ops.
