A Guide to the Zillow Housing Confidence Index

Today, we released the first edition of the Zillow Housing Confidence Index (ZHCI), sponsored by Zillow and developed and administered by Pulsenomics LLC.
The index is designed to offer deep insights into homeowners’ and renters’ intentions and attitudes concerning the housing market and to be a forward-looking gauge of housing market health. It is based on a unique, national cell phone and landline survey – the U.S. Housing Confidence Survey (HCS) – consisting of more than 10,000 interviews and collecting more than 300,000 consumer responses pertaining to real estate markets across 20 different metros. Metros covered include: Atlanta, Boston, Chicago, Dallas, Denver, Detroit, Las Vegas, Los Angeles, Miami, Minneapolis, New York, Philadelphia, Phoenix, St. Louis, San Diego, San Francisco, San Jose, Seattle, Tampa and Washington, D.C.
The Zillow Housing Confidence Index consists of a headline Housing Confidence Index (HCI), measuring top-line consumer confidence in housing, and three smaller sub-indices measuring more specific parts of the market. These sub-indices are rolled into the larger index. The three smaller indices are the:
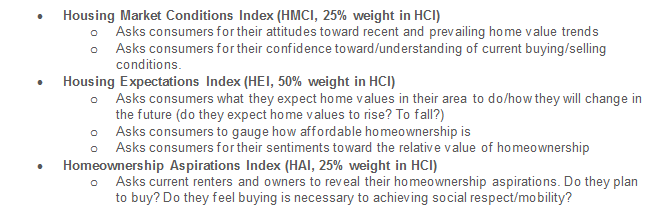
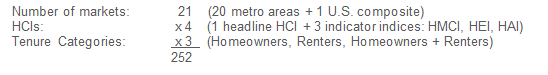
Based on more than 300,000 individual consumer responses gathered from HCS, Pulsenomics calculates a headline HCI and the three underlying indices at the individual metropolitan market level. In addition to the four indices produced for the total of all surveyed households in each metro market, Pulsenomics calculates tenure-specific sub-indices for each city, i.e., headline and indicator HCIs for (a) the subset of respondents who are homeowners and (b) the subset of respondents who are renters.
Each edition of the HCIs includes a total of 252 HCI values:
The component indices are computed using a weighted diffusion index methodology. Diffusion indices measure the degree that data are diffused (dispersed) within a sample. The table below provides an overview of key themes addressed in the survey and the contributors to each of the three confidence indicator indices that comprise the headline HCI.
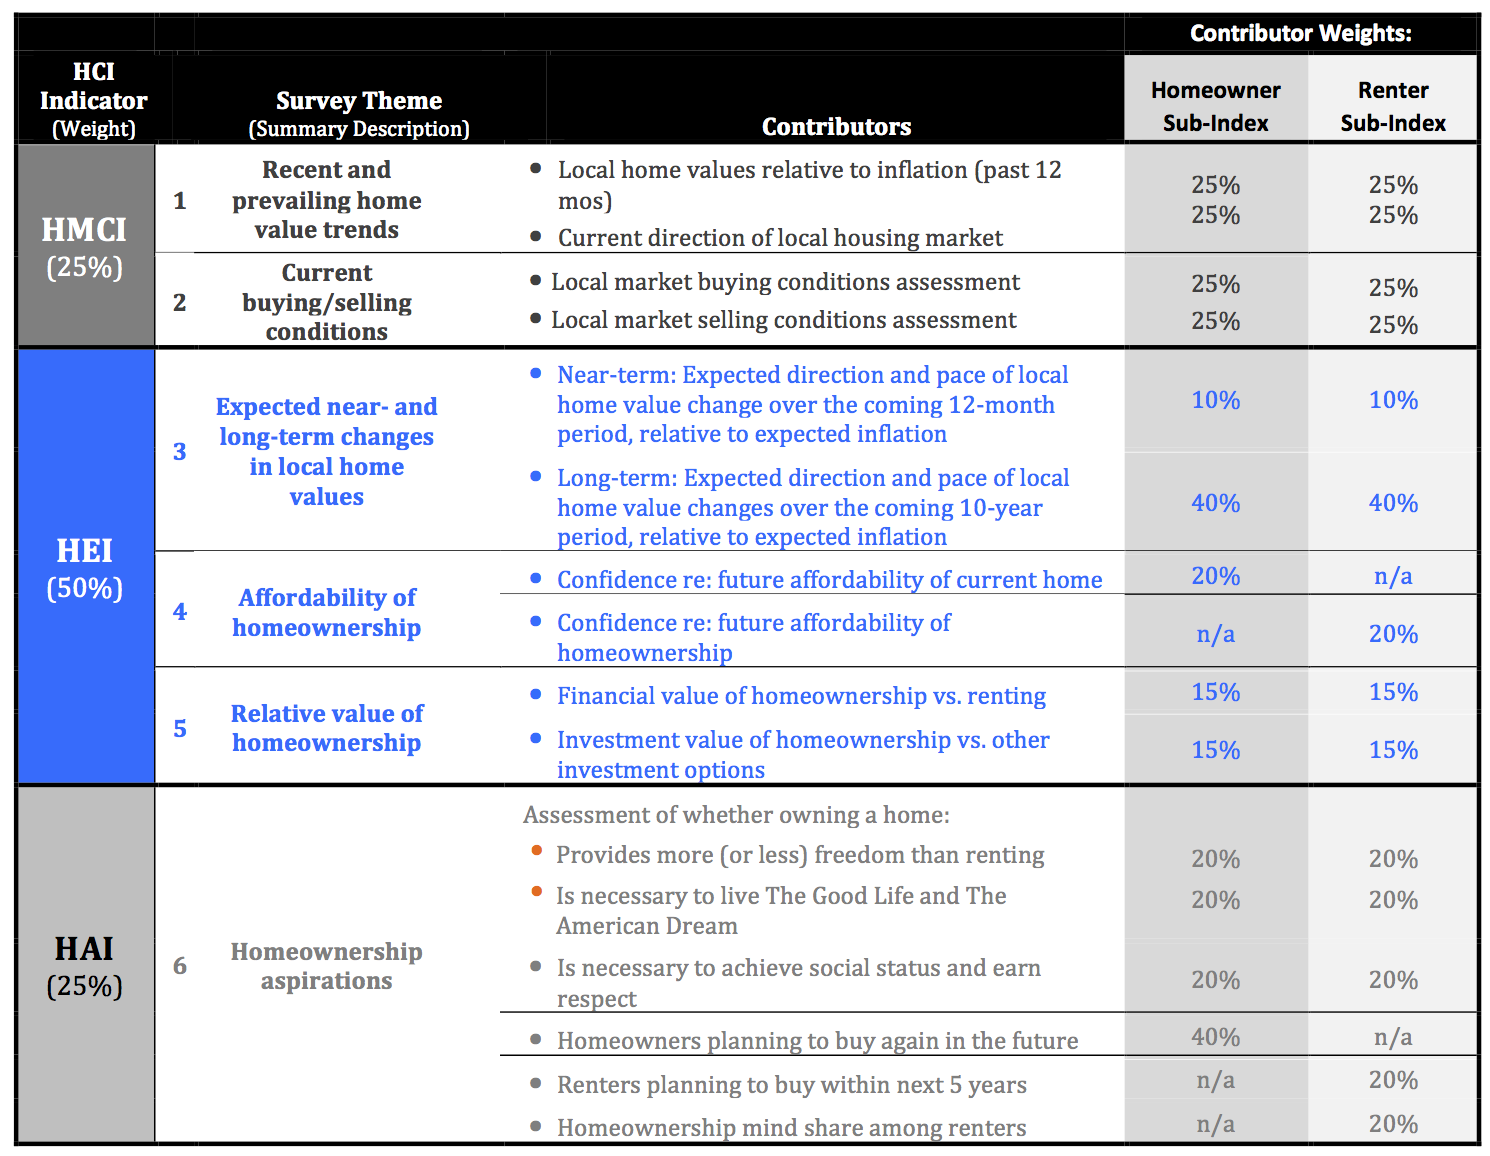
In summary, surveyed consumers are asked roughly 30 questions, which are segmented, weighted, cross-tabbed and rolled into the sub-indices and main index. The indices are measured on a scale of 0-100, with readings above 50 representing generally positive sentiment, and readings below 50 indicating negative sentiment.
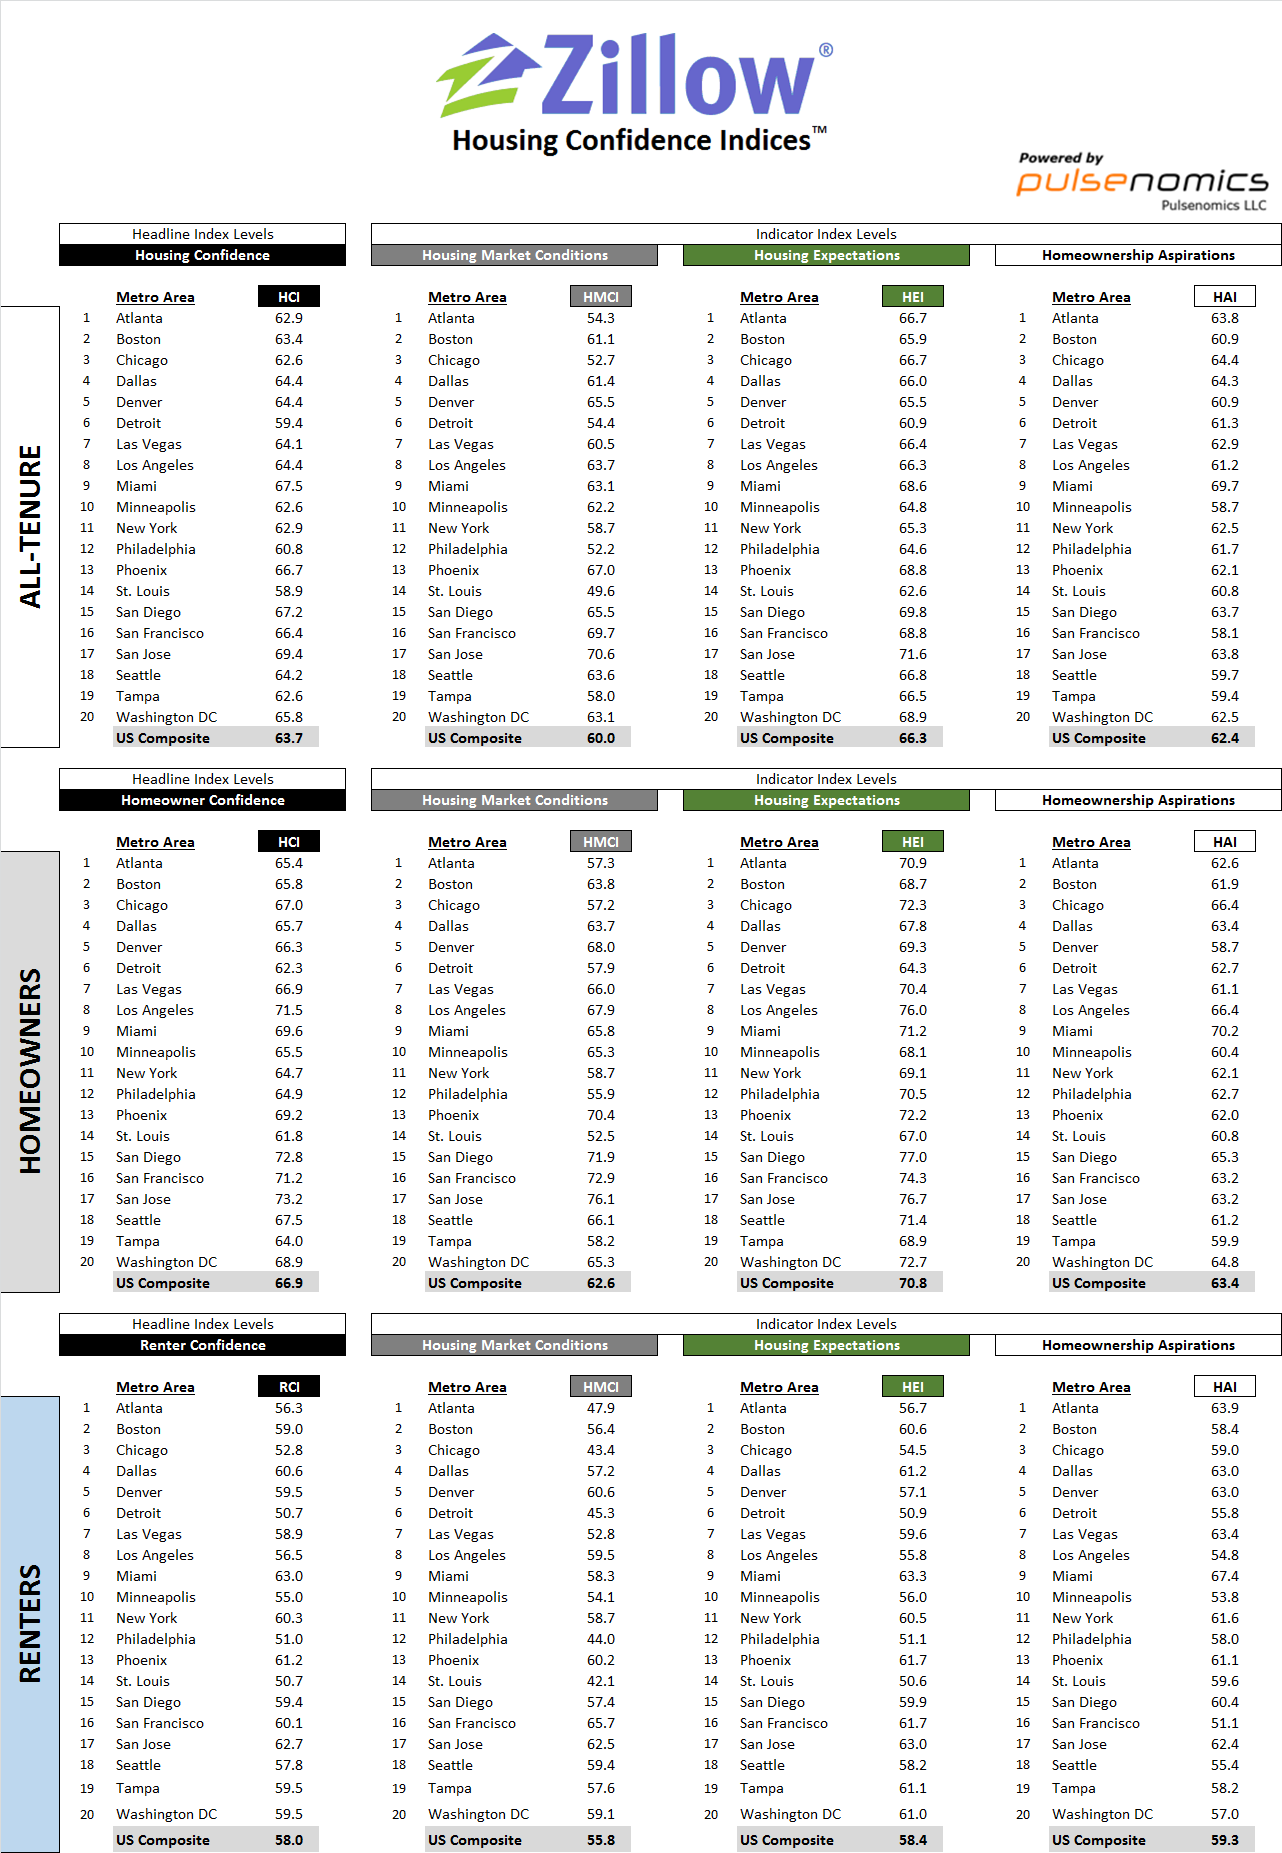
The results from the first Zillow Housing Confidence Index can be found below.
For further detail on how the indices are computed, visit Pulsenomics.
