Determining just how easy it is (or isn’t) to get a mortgage now relative to other points in time is no easy task. But we’ve gone ahead and done it anyway.
The flow of housing credit was largely unrestrained prior to the subprime mortgage crisis. And in response to the crisis, housing credit all but evaporated. But what has happened since is much less clear, particularly because measuring credit conditions is difficult and often inaccurate.
It is difficult to capture mortgage credit availability with one single metric, because a number of factors play a role in determining whether a loan applicant is approved. This includes credit history, proof of income, loan size, documentation and down payment size. On top of approval, there are also issues of interest rates, mortgage insurance premiums and the type of loan issued. All of these variables impact credit conditions, making quantifying credit access a multidimensional problem.
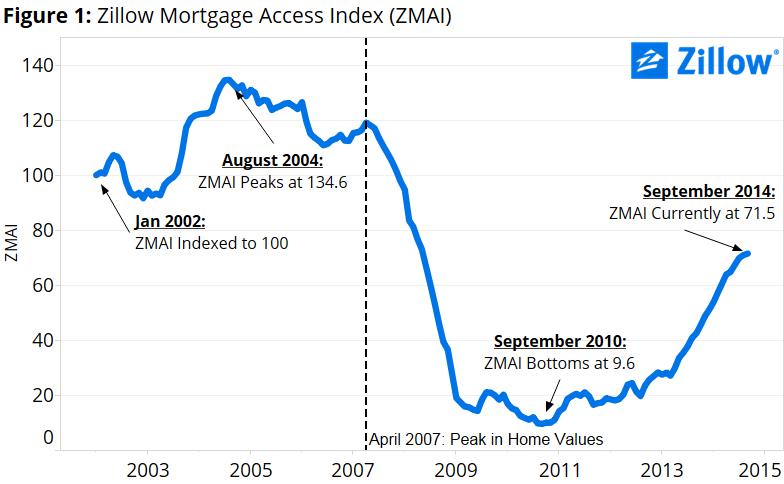 The new Zillow Mortgage Access Index (ZMAI) accounts for seven of these factors and dates back to 2002.
The index shows an abrupt and virtual evaporation of housing credit between 2008 and 2009. At the close of 2007, ZMAI stood strong at 97.8 points, but tumbled all the way to 28 points by the end of 2008. For the next four years, it showed no signs of credit conditions improving. It wasn’t until May 2013 when ZMAI again reached the 30-point threshold.
Since then, however, ZMAI has shown considerable signs of steady improvement. The index currently sits at a value of 71.5, and its steady rise shows no signs of slowing.
In creating ZMAI, we accounted for seven mortgage credit availability factors, measured on a monthly basis from 2002 onward. We took the first principal component of the seven variables[1], scaled the series and shifted the index to 100 in January 2002. The following is a brief description of each of the variables we included, along with their individual time series.
Using Fannie Mae Loan Acquisition data, we tracked the lowest 10th percentile of borrower credit scores (CS10). CS10 gives a sense of which borrowers were on the cusp of denial in a given month[2]. Rising CS10 values indicate tighter lending standards. For example, in late 2007 we see that borrowers in the bottom 10th percentile of credit scores had a score of approximately 630. By the end of 2008, CS10 would balloon to over 700. Essentially, an individual with a credit score of 630 would have had virtually no chance of being approved for a conforming mortgage at that moment in time. According to CS10, credit remained tight until approximately 2013.
Debt-to-Income (DTI90)
Again using Fannie Mae Loan Acquisition data, we tracked the 90th percentile of borrowers’ debt-to-income ratios (DTI90) on a monthly basis. Debt-to-income is the percentage of a homeowner’s income used to finance all forms of debt (including student loans, car payments, etc.). A fall in DTI90 signals tighter lending standards as it becomes more difficult to obtain a sizeable loan, especially if a large percentage of your income is already financing other debts.
DTI90 paints a similar picture to CS10 in that it gradually eases from 2002 to 2008 before making a dramatic shift towards credit tightening between 2008 and 2009. Beginning in 2010, Fannie Mae restricted debt-to-income ratios to 45 percent, which has remained at that level since.
Privately Insured Proportion (PIP)
When borrowers cannot or do not make a 20 percent down payment on a home, they have three options: Buy private mortgage insurance (PMI); take out a loan backed by the Federal Housing Administration (FHA), which requires expensive upfront payments, among other pricey features; or finance the down payment with a piggyback loan (see Second Mortgages variable). Between the first two options, PMI doesn’t require an upfront mortgage insurance premium, generally has lower interest rate premiums and automatically subsides when a borrower’s equity in their home reaches 22 percent, which currently is not the case with FHA loans. This typically makes PMI the better option for borrowers.
But when credit is tight, PMI availability shrinks and the FHA (largely by design, it should be noted) tends to dominate the low-down-payment market. For this reason, as a sign of credit access, we looked at the proportion of low-down-payment loans that are privately insured. From 2008 to 2010, PMI dropped from 80 percent market share to only 15 percent, but it has steadily climbed since the bottom. Currently, the market is roughly evenly split between PMI and FHA (versus the 60-40 split in favor of PMI in 2002).
Non-Conforming Proportion (NCP)
Of those loans where the borrower was able to put down 20 percent or more, we calculated what proportion of loans were non-conforming. Non-conforming loans are loans that Fannie Mae and Freddie Mac – the two largest guarantors, purchasers and securitizers of loans in the country – will not purchase, because they don’t meet their underwriting standards (e.g., credit score requirements, loan limits, income documentation, etc.). Non-conforming loans are therefore riskier investments for lenders, and when credit is tight, their willingness to offer them plummets.
Second Mortgage Prevalence (SMP)
In order to avoid mortgage insurance entirely, borrowers with low down payments also have the option of taking out a second loan to finance the down payment (known as a “piggyback loan”). A piggyback loan comes in the form of either a home equity loan or line of credit. Home equity financing is also an option when borrowers want to borrow against the equity in their home (often to finance a remodel or any other large investment). When credit tightens, lenders rein in the availability of second mortgages, so the prevalence of second mortgages (or lack thereof) is another sign of credit tightening.
Mortgage Rate Spread (MRS)
Charging higher mortgage rates is another way for lenders to tighten credit, so ZMAI also accounts for the spread between monthly, 30-year fixed mortgage rates and ten-year treasury bond rates.
Zillow Mortgage Quotes Ratio (ZMQR)
The final variable accounted for in ZMAI uses Zillow data on the number of quotes offered to potential borrowers through Zillow Mortgages. We tracked the monthly average number of quotes received for riskier individuals with credit scores between 600 and 640, versus the number of quotes received for more ideal borrowers (with credit scores of 760+)[3]. For example, a monthly score of 0.6 indicates that the lower-credit-score group was receiving 60 percent of the total quotes a borrower in the other group would receive, or six quotes for every 10 received by borrowers with better credit.
Putting It All Together
With ZMAI, we now have a formula that boils these credit variables down into a single metric[4]. This allows us to calculate precisely how much each of the seven variables has influenced ZMAI over a given timeframe. For example, from January 2002 to September 2014, ZMAI dropped 28.5 points. DTI90 and CS10 were the largest contributors to this drop, with 10.7 and 10.4 points respectively.
The following bar chart allows you to see how much ZMAI has moved along with how much of this movement each variable contributed.
[1] There is a one-year lag when Fannie Mae releases the loan data used for the CS10 variable, so we forecasted it forward nine months using a combination of the other variables.
[2] Principal components allow us to summarize a set of variables, while retaining as much of those variables’ information as possible.
[3] This data unfortunately only goes back to 2012, so we back-casted the series to 2002.
[4] The formula for ZMAI is ZMAI = 0.2784(CS10) + 1.5229(DTI90) + 41.17047(PIP) + 220.35099(NCP) + 142.33314(SMP) + -2.68241(MRS) + 50.62175(ZMQR) + 111.03123.
