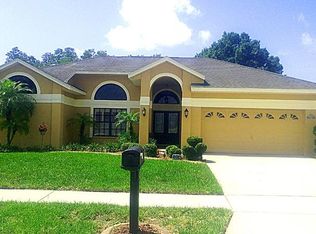
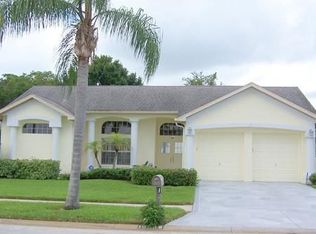
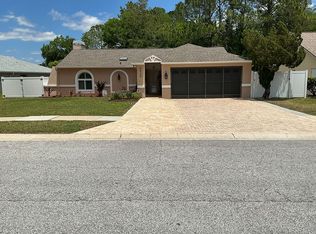
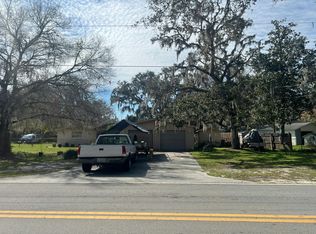
This 1867 square foot single family home has 3 bedrooms and 2.0 bathrooms. This home is located at 10104 Beefmaster Ct, New Port Richey, FL 34655.
Foreclosed
Est. $375,300
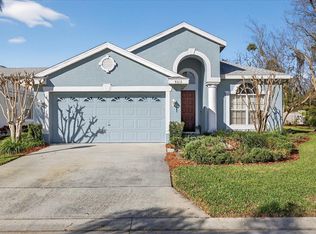
10104 Beefmaster Ct, New Port Richey, FL 34655
3beds
1,867sqft
SingleFamily
Built in 1995
9,178 Square Feet Lot
$375,300 Zestimate®
$201/sqft
$-- HOA
Overview
- 403 days |
- 46 |
- 2 |
Facts & features
Interior
Bedrooms & bathrooms
- Bedrooms: 3
- Bathrooms: 2
- Full bathrooms: 2
Heating
- Other, Electric
Cooling
- Central
Appliances
- Included: Dishwasher, Dryer, Range / Oven, Refrigerator, Washer
Features
- Flooring: Tile, Carpet, Laminate
- Has fireplace: Yes
Interior area
- Total interior livable area: 1,867 sqft
Property
Parking
- Parking features: Carport, Garage - Attached
Features
- Exterior features: Stucco
Lot
- Size: 9,178 Square Feet
Details
- Parcel number: 0726170070000000660
Construction
Type & style
- Home type: SingleFamily
Materials
- Concrete Block
- Roof: Shake / Shingle
Condition
- Year built: 1995
Community & HOA
Location
- Region: New Port Richey
Financial & listing details
- Price per square foot: $201/sqft
- Tax assessed value: $323,025
- Annual tax amount: $2,793
Visit our professional directory to find a foreclosure specialist in your area that can help with your home search.
Find a foreclosure agentForeclosure details
Estimated market value
$375,300
$353,000 - $398,000
$2,470/mo
Price history
| Date | Event | Price |
|---|---|---|
| 4/29/2025 | Sold | $244,100+25.8%$131/sqft |
Source: Public Record Report a problem | ||
| 4/22/2016 | Sold | $194,000$104/sqft |
Source: Stellar MLS #U7759582 Report a problem | ||
| 2/9/2016 | Price change | $194,000-2.5%$104/sqft |
Source: RE/MAX REALTEC GROUP #U7759582 Report a problem | ||
| 1/19/2016 | Price change | $199,000-0.5%$107/sqft |
Source: RE/MAX REALTEC GROUP #U7759582 Report a problem | ||
| 12/11/2015 | Listed for sale | $200,000+33.3%$107/sqft |
Source: RE/MAX REALTEC GROUP #U7759582 Report a problem | ||
| 12/18/2012 | Sold | $150,000+0.4%$80/sqft |
Source: Public Record Report a problem | ||
| 11/13/2012 | Price change | $149,400-0.1%$80/sqft |
Source: THE SHERIDAN NETWORK.COM #A3964852 Report a problem | ||
| 9/14/2012 | Price change | $149,500-0.3%$80/sqft |
Source: THE SHERIDAN NETWORK.COM #A3964852 Report a problem | ||
| 9/7/2012 | Price change | $149,900-3.2%$80/sqft |
Source: THE SHERIDAN NETWORK.COM #A3964852 Report a problem | ||
| 7/16/2012 | Price change | $154,900-3.1%$83/sqft |
Source: ADDvantage Real Estate #T2514691 Report a problem | ||
| 6/19/2012 | Price change | $159,900-3%$86/sqft |
Source: ADDvantage Real Estate #T2514691 Report a problem | ||
| 4/18/2012 | Listed for sale | $164,900+174.8%$88/sqft |
Source: ADDvantage Real Estate #T2514691 Report a problem | ||
| 1/20/2012 | Sold | $60,000-54.2%$32/sqft |
Source: Public Record Report a problem | ||
| 5/1/2000 | Sold | $131,000$70/sqft |
Source: Public Record Report a problem | ||
Public tax history
| Year | Property taxes | Tax assessment |
|---|---|---|
| 2024 | $2,793 +4% | $190,640 |
| 2023 | $2,685 +11.4% | $190,640 +3% |
| 2022 | $2,411 +2.1% | $185,090 +6.1% |
| 2021 | $2,360 +1.7% | $174,470 +1.4% |
| 2020 | $2,320 +1.5% | $172,070 +2.3% |
| 2019 | $2,286 | $168,210 +1.9% |
| 2018 | $2,286 +2% | $165,074 +2.1% |
| 2017 | $2,240 +0.6% | $161,679 +31.2% |
| 2016 | $2,227 +39.7% | $123,223 +0.7% |
| 2015 | $1,594 +3% | $122,366 -9.1% |
| 2014 | $1,548 | $134,567 +12.5% |
| 2013 | -- | $119,601 +42.6% |
| 2012 | -- | $83,876 -5.5% |
| 2011 | -- | $88,777 -33.4% |
| 2010 | -- | $133,301 -15.3% |
| 2009 | -- | $157,307 -13.5% |
| 2008 | -- | $181,928 -11.2% |
| 2007 | -- | $204,885 -2.7% |
| 2006 | -- | $210,558 +23.6% |
| 2005 | -- | $170,303 +19.9% |
| 2004 | -- | $142,055 +9.2% |
| 2003 | -- | $130,125 +9.8% |
| 2002 | -- | $118,505 +7.4% |
| 2000 | -- | $110,384 +2.8% |
| 1999 | -- | $107,344 |
Find assessor info on the county website
Monthly payment
Estimated monthly payment$1,822
All calculations are estimates and provided by Zillow, Inc. for informational purposes only. Actual amounts may vary.
HOA fees may include property taxes on listings classified as Co-Ops. Contact the listing agent and/or owner for fee details.
Mortgage interest rates are dependent on a number of factors, including credit score, down payment, and repayment length. Interest rate data provided by Zillow Group Marketplace, Inc. as of 1/1/1970 from various mortgage lenders with which we have lead or other similar arrangements; the Estimated Payment is an average of those rates.
See how much you could borrow to make a competitive offer.
Climate risks
Neighborhood: 34655
Nearby schools
GreatSchools rating
- 7/10Longleaf Elementary SchoolGrades: PK-5Distance: 2.2 mi
- 5/10River Ridge Middle SchoolGrades: 6-8Distance: 2.5 mi
- 5/10River Ridge High SchoolGrades: PK,9-12Distance: 2.5 mi


- Florida
- Pasco County
- New Port Richey
- 34655
- 10104 Beefmaster Ct
Nearby cities
Nearby neighborhoods
Nearby zip codes
Other New Port Richey Topics
