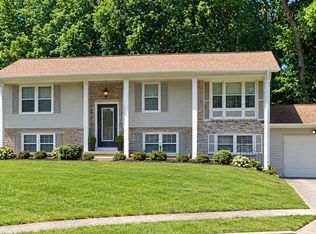
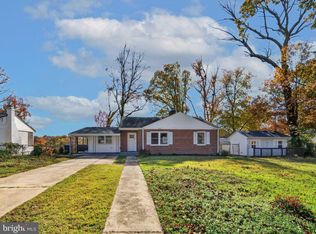
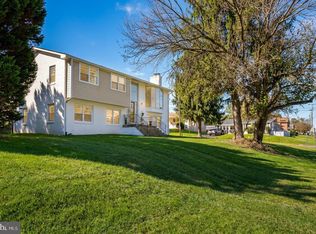
$504,000
4 bd2 ba2.5k sqft
12214 Brolass Rd, Clinton, MD 20735
Off Market
Zillow last checked:
Listing updated:
Steve Patten 571-529-2202,
KW Metro Center 7032246000,
Listing Team: The Steve Patten Team LLC

Not available
Estimated sales range
Not available
Not available
| Date | Event | Price |
|---|---|---|
| 11/13/2026 | Listed for sale | $465,000-5.1%$254/sqft |
Source:  Bright MLS #MDPG2225388 Report a problem | ||
| 11/4/2026 | Listing removed | $3,400$2/sqft |
Source: Bright MLS #MDPG2221250 Report a problem | ||
| 11/1/2026 | Listing removed | $490,000$267/sqft |
Source: Bright MLS #MDPG2212478 Report a problem | ||
| 10/2/2026 | Listed for rent | $3,400$2/sqft |
Source: Bright MLS #MDPG2221250 Report a problem | ||
| 9/15/2026 | Price change | $490,000-2%$267/sqft |
Source: Bright MLS #MDPG2212478 Report a problem | ||
| 8/15/2026 | Price change | $500,000-2.9%$273/sqft |
Source: Bright MLS #MDPG2212478 Report a problem | ||
| 7/28/2026 | Listed for sale | $515,000+19.8%$281/sqft |
Source: Bright MLS #MDPG2212478 Report a problem | ||
| 7/1/2021 | Sold | $430,000+60.7%$235/sqft |
Source: Public Record Report a problem | ||
| 2/1/2021 | Sold | $267,500+7%$146/sqft |
Source: Public Record Report a problem | ||
| 12/9/2020 | Pending sale | $249,900$136/sqft |
Source: Jim Hall Real Estate #MDPG590540 Report a problem | ||
| 12/3/2020 | Listed for sale | $249,900+38.9%$136/sqft |
Source: Jim Hall Real Estate #MDPG590540 Report a problem | ||
| 2/20/2013 | Sold | $179,900+35.3%$98/sqft |
Source: Public Record Report a problem | ||
| 11/8/2012 | Sold | $133,000$73/sqft |
Source: Public Record Report a problem | ||
| Year | Property taxes | Tax assessment |
|---|---|---|
| 2026 | $6,775 | $442,300 +3.1% |
| 2025 | $6,775 +46.6% | $429,000 +3.2% |
| 2024 | $4,623 +8% | $415,700 +8% |
| 2023 | $4,280 -7.4% | $384,900 -7.4% |
| 2022 | $4,623 +28.6% | $415,700 +28.6% |
| 2021 | $3,595 +7.8% | $323,300 +7.8% |
| 2020 | $3,336 -11.4% | $299,967 +18.4% |
| 2019 | $3,764 | $253,300 |
| 2018 | $3,764 +12.1% | $253,300 +12.1% |
| 2017 | $3,357 -9.8% | $225,933 +13.8% |
| 2016 | $3,723 | $198,567 +16% |
| 2015 | $3,723 | $171,200 |
| 2014 | $3,723 | $171,200 |
| 2013 | -- | $171,200 -27.4% |
| 2012 | -- | $235,900 |
| 2011 | -- | $235,900 |
| 2010 | -- | $235,900 -30.5% |
| 2009 | -- | $339,600 +18.8% |
| 2008 | -- | $285,742 +23.2% |
| 2007 | -- | $231,886 +30.3% |
| 2006 | -- | $178,030 +7.1% |
| 2005 | -- | $166,256 +7.6% |
| 2004 | -- | $154,483 +8.2% |
| 2003 | -- | $142,710 |
| 2002 | -- | $142,710 +2.8% |
| 2001 | -- | $138,850 |
Source: Bright MLS. This data may not be complete. We recommend contacting the local school district to confirm school assignments for this home.

A local agent can set up tours, give advice and negotiate with sellers.