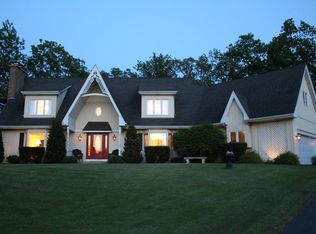
$1,475,500
5 bd3 ba5.3k sqft
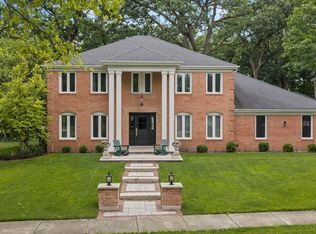
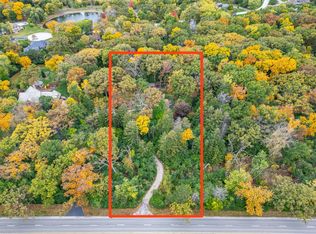
1S350 Winfield Rd, Wheaton, IL 60189
Off Market
Zillow last checked:
Listing updated:
Laura Bougadis 847-417-2290,
john greene, Realtor
Not available
Estimated sales range
Not available
Not available
| Date | Event | Price |
|---|---|---|
| 6/18/2026 | Listing removed | $1,499,000$256/sqft |
Source: MRED as distributed by MLS GRID #12649371 Report a problem | ||
| 5/15/2026 | Price change | $1,499,000-9.2%$256/sqft |
Source: | ||
| 5/6/2026 | Listed for sale | $1,650,000+85.4%$282/sqft |
Source: | ||
| 4/30/2013 | Sold | $890,000-9.6%$152/sqft |
Source: | ||
| 5/16/2012 | Listed for sale | $985,000-16.5%$168/sqft |
Source: Coldwell Banker Residential Brokerage - Wheaton #08067219 Report a problem | ||
| 9/2/2010 | Listing removed | $1,180,000$202/sqft |
Source: NRT Chicago #07314692 Report a problem | ||
| 9/23/2009 | Price change | $1,180,000-1.3%$202/sqft |
Source: NRT Chicago #07314692 Report a problem | ||
| 2/5/2009 | Price change | $1,195,000-4.4%$204/sqft |
Source: Baird & Warner - Glen Ellyn #06818381 Report a problem | ||
| 10/19/2008 | Price change | $1,250,000-7.3%$214/sqft |
Source: Baird & Warner - Glen Ellyn #06818381 Report a problem | ||
| 7/31/2008 | Listed for sale | $1,349,000+75.2%$231/sqft |
Source: Baird & Warner - Glen Ellyn #06818381 Report a problem | ||
| 5/21/1997 | Sold | $770,000$132/sqft |
Source: Public Record Report a problem | ||
| Year | Property taxes | Tax assessment |
|---|---|---|
| 2024 | $33,404 +5.6% | $424,416 +9.5% |
| 2023 | $31,644 +5.1% | $387,630 +7% |
| 2022 | $30,100 +5.7% | $362,270 +4.3% |
| 2021 | $28,468 +1.8% | $347,270 +3.1% |
| 2020 | $27,978 +2.6% | $336,730 +5% |
| 2019 | $27,276 -1.6% | $320,660 0% |
| 2018 | $27,727 +2.2% | $320,670 +5.2% |
| 2017 | $27,130 +1.7% | $304,700 +7.3% |
| 2016 | $26,663 +1.6% | $284,100 +8% |
| 2015 | $26,245 -1% | $262,980 +0.5% |
| 2014 | $26,520 -0.3% | $261,730 -3.5% |
| 2013 | $26,590 +5% | $271,310 -7.9% |
| 2012 | $25,327 +0.5% | $294,510 -9.5% |
| 2011 | $25,197 -8.4% | $325,460 -15.7% |
| 2010 | $27,501 +3.6% | $386,080 -4.4% |
| 2009 | $26,540 +0.8% | $403,810 |
| 2008 | $26,318 +6.3% | $403,810 +7.2% |
| 2007 | $24,748 +4.6% | $376,690 +7% |
| 2006 | $23,653 +3.6% | $352,040 +6.5% |
| 2005 | $22,838 +5.4% | $330,550 +6.1% |
| 2004 | $21,667 +4.3% | $311,550 +7% |
| 2003 | $20,780 +9.3% | $291,160 +10.1% |
| 2002 | $19,011 +16.4% | $264,420 +7.5% |
| 2001 | $16,338 +3.3% | $245,990 +5.3% |
| 2000 | $15,819 | $233,610 |
Source: MRED as distributed by MLS GRID. This data may not be complete. We recommend contacting the local school district to confirm school assignments for this home.
A local agent can set up tours, give advice and negotiate with sellers.