Amazing and profitable Airbnb. 4 apartments total. Each unit was bringing in between 2 and 3 thousand a month a few years ago. I have the records to demonstrate. I moved to a new state 3 years ago and changed it to medium term rentals, where it makes about 6k a month at the moment.
Completely remodeled in 2019.
Sits on a beautiful, large lot overlooking the valley on a private, dead end street in a quiet neighborhood.
For sale by owner
$829,000
27 Hambrick Rd, Nitro, WV 25143
7beds
2,400sqft
MultiFamily
Built in 1984
-- sqft lot
$181,200 Zestimate®
$345/sqft
$-- HOA
What's special
Beautiful large lotQuiet neighborhoodPrivate dead end streetOverlooking the valley
- 2 days
- 183
- 3
Listed by:
Property Owner (304) 415-3424
Facts & features
Interior
Bedrooms & bathrooms
- Bedrooms: 7
- Bathrooms: 4
- Full bathrooms: 4
Heating
- Forced air
Cooling
- Central
Features
- Basement: Finished
Interior area
- Total interior livable area: 2,400 sqft
Property
Features
- Exterior features: Other
Lot
- Size: 0.5 Acres
Details
- Parcel number: 2025021E00110000
Construction
Type & style
- Home type: MultiFamily
Materials
- Frame
Condition
- New construction: No
- Year built: 1984
Community & HOA
Location
- Region: Nitro
Financial & listing details
- Price per square foot: $345/sqft
- Tax assessed value: $128,500
- Annual tax amount: $1,943
- Date on market: 10/28/2026
Estimated market value
$181,200
$147,000 - $216,000
$1,323/mo
Price history
| Date | Event | Price |
|---|---|---|
| 10/28/2026 | Listed for sale | $829,000+95.1%$345/sqft |
Source: Owner Report a problem | ||
| 5/20/2024 | Listing removed | -- |
Source: Zillow Rentals Report a problem | ||
| 5/2/2024 | Listed for rent | $1,500$1/sqft |
Source: Zillow Rentals Report a problem | ||
| 3/19/2024 | Listing removed | -- |
Source: Zillow Rentals Report a problem | ||
| 2/27/2024 | Listed for rent | $1,500+3.4%$1/sqft |
Source: Zillow Rentals Report a problem | ||
| 1/5/2024 | Listing removed | -- |
Source: Zillow Rentals Report a problem | ||
| 12/15/2023 | Listed for rent | $1,450$1/sqft |
Source: Zillow Rentals Report a problem | ||
| 9/18/2023 | Listing removed | -- |
Source: Owner Report a problem | ||
| 4/26/2023 | Listed for sale | $425,000+936.6%$177/sqft |
Source: Owner Report a problem | ||
| 5/3/2017 | Sold | $41,000+2.8%$17/sqft |
Source: Public Record Report a problem | ||
| 4/20/2011 | Listing removed | $39,900$17/sqft |
Source: foreclosure.com Report a problem | ||
| 4/9/2011 | Price change | $39,900-20%$17/sqft |
Source: foreclosure.com Report a problem | ||
| 3/5/2011 | Price change | $49,900-10.9%$21/sqft |
Source: foreclosure.com Report a problem | ||
| 3/3/2011 | Price change | $56,000+99900%$23/sqft |
Source: foreclosure.com Report a problem | ||
| 2/25/2011 | Price change | $56-99.9% |
Source: foreclosure.com Report a problem | ||
| 1/12/2011 | Price change | $56,000-11.1%$23/sqft |
Source: foreclosure.com Report a problem | ||
| 1/1/2011 | Listed for sale | $63,000$26/sqft |
Source: foreclosure.com Report a problem | ||
| 10/9/2010 | Listing removed | $63,000$26/sqft |
Source: foreclosure.com Report a problem | ||
| 9/16/2010 | Price change | $63,000-19.2%$26/sqft |
Source: foreclosure.com Report a problem | ||
| 6/26/2010 | Price change | $78,000-4.9%$33/sqft |
Source: foreclosure.com Report a problem | ||
| 6/11/2010 | Price change | $82,000-7.9%$34/sqft |
Source: foreclosure.com Report a problem | ||
| 4/29/2010 | Listed for sale | $89,000+3.2%$37/sqft |
Source: foreclosure.com Report a problem | ||
| 6/12/2000 | Sold | $86,211$36/sqft |
Source: Public Record Report a problem | ||
Public tax history
| Year | Property taxes | Tax assessment |
|---|---|---|
| 2025 | $1,943 -1.2% | $77,100 -1.2% |
| 2024 | $1,965 +5.4% | $78,000 +5.4% |
| 2023 | $1,864 | $73,980 +5.7% |
| 2022 | -- | $69,960 +7.2% |
| 2021 | -- | $65,280 |
| 2020 | -- | $65,280 -1.3% |
| 2019 | $1,666 +12.5% | $66,120 |
| 2018 | $1,481 +2% | $66,120 +2.2% |
| 2017 | $1,452 -1.3% | $64,680 -1.2% |
| 2016 | $1,472 | $65,460 -1.4% |
| 2015 | $1,472 +1.7% | $66,360 +1.2% |
| 2014 | $1,448 +15.9% | $65,580 +10.1% |
| 2013 | $1,249 | $59,580 +5.9% |
| 2012 | $1,249 +4.8% | $56,280 +7.7% |
| 2011 | $1,192 -0.4% | $52,260 |
| 2010 | $1,197 -3.5% | $52,260 -0.8% |
| 2009 | $1,240 -1.2% | $52,680 |
| 2008 | $1,256 +3% | $52,680 +2.3% |
| 2007 | $1,219 -1.4% | $51,480 |
| 2006 | $1,236 +0.1% | $51,480 |
| 2005 | $1,235 | $51,480 +24.3% |
| 2004 | -- | $41,400 |
| 2003 | -- | $41,400 |
| 2002 | -- | $41,400 +21.3% |
| 2001 | -- | $34,140 |
Find assessor info on the county website
Monthly payment
Est. payment
Payment breakdown
Explore the cost of this home by adjusting the details. Changes won't be saved.Climate risks
Neighborhood: Cross Lanes


Similar homes
- $599,9005 bd5 ba3.2k sqft703 Laurel Rd, Charleston, WV 25314For Sale
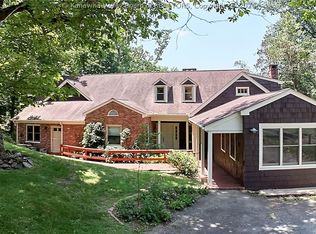 MLS ID #286097, Misty Harris. KVBR
- $515,0004 bd4 ba3.3k sqft2045 Parkwood Rd, Charleston, WV 25314For Sale
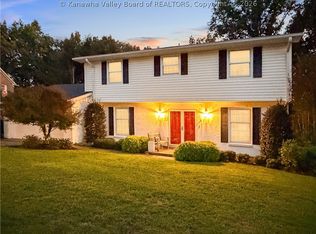 MLS ID #286135, Christie Goldman. KVBR
- $579,9005 bd3 ba3.5k sqft1127 Hawkins Rd, Red House, WV 25168For Sale
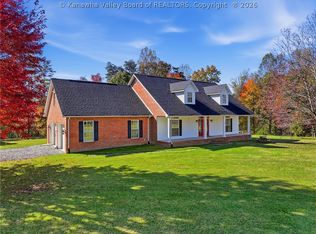 MLS ID #286200, Gina Dailey. KVBR
- $550,0004 bd3 ba3.4k sqft995 Bear Branch Rd, Leon, WV 25123For Sale
 MLS ID #286201, Daphne Keesecker. KVBR
- $470,0004 bd3 ba3k sqft101 Litton Hts, Scott Depot, WV 25560For Sale
 MLS ID #184254, Jeanette Mansour, Old Colony Realtors Huntington. HUNTMLS
