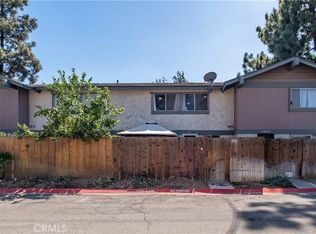
$359,600
3 bd2 ba1k sqft
9230 Delano Dr, Riverside, CA 92503
Off Market
Likely to sell faster than
Zillow last checked:
Listing updated:
ROSA ROBLES DRE #01123306 951-237-5751,
3D REALTY
 Originating MLS: California Regional MLS
$439,700
$418,000 - $462,000
$2,531/mo
| Date | Event | Price |
|---|---|---|
| 10/13/2026 | Listed for sale | $439,000+41709.5%$424/sqft |
Source:  CRMLS #IV26222206 Report a problem | ||
| 1/27/2024 | Listing removed | -- |
Source: Zillow Rentals Report a problem | ||
| 1/17/2024 | Price change | $2,450-2%$2/sqft |
Source: Zillow Rentals Report a problem | ||
| 1/10/2024 | Price change | $2,500-2%$2/sqft |
Source: Zillow Rentals Report a problem | ||
| 12/29/2023 | Listed for rent | $2,550$2/sqft |
Source: Zillow Rentals Report a problem | ||
| 11/22/2022 | Listing removed | -- |
Source: Zillow Rental Network Premium Report a problem | ||
| 11/3/2022 | Listed for rent | $2,550+56.9%$2/sqft |
Source: Zillow Rental Network Premium Report a problem | ||
| 7/26/2017 | Listing removed | $1,625$2/sqft |
Source: Management One Report a problem | ||
| 7/25/2017 | Price change | $1,625-1.5%$2/sqft |
Source: Management One Report a problem | ||
| 7/14/2017 | Listed for rent | $1,650$2/sqft |
Source: Zillow Rental Manager Report a problem | ||
| 9/12/2010 | Listing removed | $1,050-4.1%$1/sqft |
Source: Visual Tour #K10070747 Report a problem | ||
| 8/21/2010 | Listed for sale | $1,095-99.3%$1/sqft |
Source: Visual Tour #K10070747 Report a problem | ||
| 1/7/2004 | Sold | $162,500$157/sqft |
Source: Public Record Report a problem | ||
| Year | Property taxes | Tax assessment |
|---|---|---|
| 2026 | -- | $235,631 +2% |
| 2025 | $2,607 +3.4% | $231,012 +2% |
| 2024 | $2,522 +0.4% | $226,483 +2% |
| 2023 | $2,511 +1.9% | $222,043 +2% |
| 2022 | $2,465 +0.9% | $217,690 +2% |
| 2021 | $2,443 +0.8% | $213,423 +1% |
| 2020 | $2,424 +1.8% | $211,236 +2% |
| 2019 | $2,383 +2% | $207,095 +2% |
| 2018 | $2,337 +1.8% | $203,035 +2% |
| 2017 | $2,296 | $199,055 +7.6% |
| 2016 | $2,296 +14.2% | $185,000 +1.6% |
| 2015 | $2,011 +11% | $182,000 +13% |
| 2014 | $1,812 | $161,000 +73.1% |
| 2013 | -- | $93,000 -3.1% |
| 2012 | -- | $96,000 -7.7% |
| 2011 | -- | $104,000 +9.5% |
| 2010 | -- | $95,000 -26.9% |
| 2009 | -- | $130,000 -26.1% |
| 2008 | -- | $175,893 +2% |
| 2007 | -- | $172,445 +2% |
| 2006 | -- | $169,065 +2% |
| 2005 | -- | $165,750 +56.6% |
| 2003 | -- | $105,847 +11.4% |
| 2002 | -- | $95,000 +35.7% |
| 2001 | $748 +7.1% | $70,000 +7.7% |
| 2000 | $699 | $65,000 |
Source: CRMLS. This data may not be complete. We recommend contacting the local school district to confirm school assignments for this home.


A local agent can set up tours, give advice and negotiate with sellers.