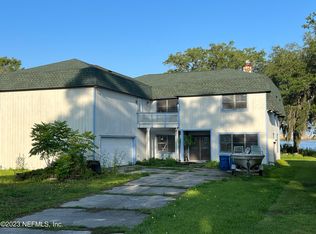
SELLER CAN RENOVATE THE PROPERTY, REPAIRS INCLUDED IN THE PRICE.OWNER-REALTOR.
Active
Price cut: $22 (3/8)
$759,530
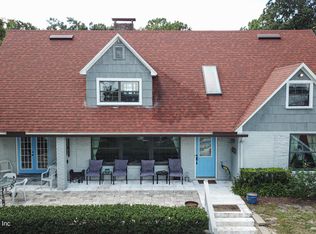
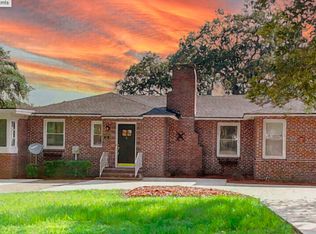
3818 SANDY SHORES Drive, Jacksonville, FL 32277
3beds
2,400sqft
Est.:
Single Family Residence
Built in 1987
0.88 Acres Lot
$-- Zestimate®
$316/sqft
$-- HOA
What's special
- 444 days |
- 1,329 |
- 26 |
Likely to sell faster than
Zillow last checked: 7 hours ago
Listing updated: March 07, 2026 at 10:10pm
Listed by:
ALEKSANDR APARNEV 904-612-0830,
VERTICAL REALTY 904-612-0830
Source: realMLS,MLS#: 2061514
Tour with a local agent
Facts & features
Interior
Bedrooms & bathrooms
- Bedrooms: 3
- Bathrooms: 3
- Full bathrooms: 3
Heating
- Central
Cooling
- Central Air
Appliances
- Included: Dryer, Electric Range, Microwave, Refrigerator, Washer/Dryer Stacked
Features
- Number of fireplaces: 1
Interior area
- Total interior livable area: 2,400 sqft
Property
Parking
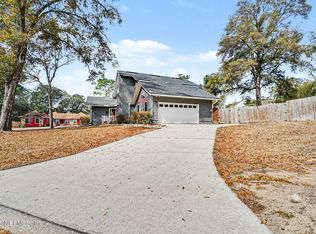
- Total spaces: 2
- Parking features: Additional Parking, Attached, Garage
- Attached garage spaces: 2
Features
- Stories: 2
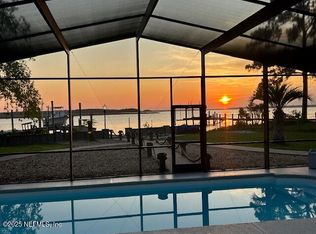
- On waterfront: Yes
- Waterfront features: Navigable Water, River Front
Lot
- Size: 0.88 Acres
- Features: Irregular Lot
Details
- Parcel number: 1123430042
Construction
Type & style
- Home type: SingleFamily
- Property subtype: Single Family Residence
Condition
- New construction: No
- Year built: 1987
Utilities & green energy
- Water: Private, Public
- Utilities for property: Electricity Connected, Water Connected
Community & HOA
Community
- Subdivision: Sandy Shores
HOA
- Has HOA: No
Location
- Region: Jacksonville
Financial & listing details
- Price per square foot: $316/sqft
- Tax assessed value: $549,194
- Annual tax amount: $5,544
- Date on market: 12/20/2024
- Listing terms: Cash,Conventional,FHA,Owner May Carry,VA Loan
Estimated market value
Not available
Estimated sales range
Not available
$2,707/mo
Price history
Price history
| Date | Event | Price |
|---|---|---|
| 3/8/2026 | Price change | $759,5300%$316/sqft |
Source: | ||
| 3/7/2026 | Price change | $759,5520%$316/sqft |
Source: | ||
| 3/2/2026 | Price change | $759,5530%$316/sqft |
Source: | ||
| 2/28/2026 | Price change | $759,5550%$316/sqft |
Source: | ||
| 2/25/2026 | Price change | $759,5560%$316/sqft |
Source: | ||
| 2/23/2026 | Price change | $759,5580%$316/sqft |
Source: | ||
| 2/21/2026 | Price change | $759,5600%$316/sqft |
Source: | ||
| 2/19/2026 | Price change | $759,5620%$316/sqft |
Source: | ||
| 2/17/2026 | Price change | $759,5640%$316/sqft |
Source: | ||
| 2/15/2026 | Price change | $759,5660%$316/sqft |
Source: | ||
| 2/13/2026 | Price change | $759,5690%$316/sqft |
Source: | ||
| 2/11/2026 | Price change | $759,5710%$316/sqft |
Source: | ||
| 2/9/2026 | Price change | $759,5730%$316/sqft |
Source: | ||
| 2/7/2026 | Price change | $759,5750%$316/sqft |
Source: | ||
| 2/6/2026 | Price change | $759,5760%$316/sqft |
Source: | ||
| 2/4/2026 | Price change | $759,5780%$316/sqft |
Source: | ||
| 2/2/2026 | Price change | $759,5800%$316/sqft |
Source: | ||
| 1/30/2026 | Price change | $759,5820%$316/sqft |
Source: | ||
| 1/28/2026 | Price change | $759,5840%$316/sqft |
Source: | ||
| 1/26/2026 | Price change | $759,5850%$316/sqft |
Source: | ||
| 1/24/2026 | Price change | $759,5870%$316/sqft |
Source: | ||
| 1/23/2026 | Price change | $759,5880%$316/sqft |
Source: | ||
| 1/19/2026 | Price change | $759,5890%$316/sqft |
Source: | ||
| 1/3/2026 | Price change | $759,5900%$316/sqft |
Source: | ||
| 12/28/2025 | Listed for sale | $759,595+385.4%$316/sqft |
Source: | ||
| 6/29/2012 | Sold | $156,500-71.7%$65/sqft |
Source: | ||
| 12/19/2011 | Sold | $553,400-21.9%$231/sqft |
Source: Public Record Report a problem | ||
| 12/13/2006 | Sold | $709,000+102.6%$295/sqft |
Source: Public Record Report a problem | ||
| 8/11/2005 | Sold | $350,000+16.7%$146/sqft |
Source: Public Record Report a problem | ||
| 7/26/2003 | Sold | $300,000$125/sqft |
Source: Public Record Report a problem | ||
Public tax history
Public tax history
| Year | Property taxes | Tax assessment |
|---|---|---|
| 2024 | $5,544 +2.8% | $339,601 +3% |
| 2023 | $5,395 +9% | $329,710 +3% |
| 2022 | $4,949 +0.6% | $320,107 +3% |
| 2021 | $4,921 +0.9% | $310,784 +1.4% |
| 2020 | $4,876 +1.1% | $306,494 +2.3% |
| 2019 | $4,825 +1.2% | $299,604 +1.9% |
| 2018 | $4,767 | $294,018 -15.3% |
| 2017 | $4,767 -17.6% | $346,934 -3.2% |
| 2016 | $5,787 -5.3% | $358,520 -17.7% |
| 2015 | $6,109 -20.4% | $435,393 +10.2% |
| 2014 | $7,671 | $395,065 +3.1% |
| 2013 | -- | $383,258 -1.3% |
| 2012 | -- | $388,240 -2.1% |
| 2011 | -- | $396,617 -10.8% |
| 2010 | -- | $444,749 -8.5% |
| 2009 | -- | $485,851 +53.2% |
| 2006 | -- | $317,036 +6.5% |
| 2005 | $5,531 | $297,769 +4.8% |
| 2004 | -- | $284,115 -11.1% |
| 2003 | $6,200 | $319,726 +36.4% |
| 2002 | -- | $234,451 +0.7% |
| 2001 | -- | $232,759 +3% |
| 2000 | -- | $225,980 +2.2% |
| 1999 | -- | $221,105 |
Find assessor info on the county website
BuyAbility℠ payment
Est. payment
$4,751/mo
Principal & interest
$3618
Property taxes
$1133
Climate risks
Neighborhood: University Park
Nearby schools
GreatSchools rating
- 4/10Fort Caroline Elementary SchoolGrades: PK-5Distance: 1.3 mi
- 3/10Arlington Middle SchoolGrades: 6-8Distance: 3.4 mi
- 2/10Terry Parker High SchoolGrades: 9-12Distance: 3 mi
Local experts in 32277