$836,000
5 bd|3 ba|2.1k sqft
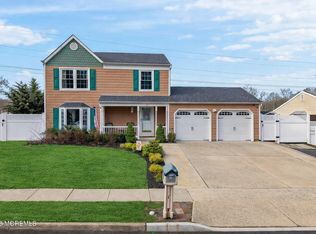
49 Sweet Gum Rd, Howell, NJ 07731
Off Market
Likely to sell faster than
Zillow last checked: 7 hours ago
Listing updated: February 16, 2026 at 11:34am
Tsivia Cynamon 347-452-7006,
Crossroads Realty Sapphire Group
$702,400
$667,000 - $738,000
$3,918/mo
| Date | Event | Price |
|---|---|---|
| 2/16/2026 | Pending sale | $699,000$293/sqft |
Source: | ||
| 1/2/2026 | Listed for sale | $699,000$293/sqft |
Source: | ||
| 12/3/2025 | Pending sale | $699,000$293/sqft |
Source: | ||
| 11/12/2025 | Price change | $699,000-5.4%$293/sqft |
Source: | ||
| 9/16/2025 | Price change | $739,000-3.9%$310/sqft |
Source: | ||
| 8/26/2025 | Listed for sale | $769,000+9.5%$323/sqft |
Source: | ||
| 11/5/2024 | Listing removed | $3,200$1/sqft |
Source: Zillow Rentals Report a problem | ||
| 10/27/2024 | Price change | $3,200-5.9%$1/sqft |
Source: Zillow Rentals Report a problem | ||
| 9/13/2024 | Price change | $3,400-5.6%$1/sqft |
Source: Zillow Rentals Report a problem | ||
| 9/6/2024 | Price change | $3,600-5.3%$2/sqft |
Source: Zillow Rentals Report a problem | ||
| 8/27/2024 | Price change | $3,800-5%$2/sqft |
Source: Zillow Rentals Report a problem | ||
| 8/18/2024 | Price change | $4,000-4.8%$2/sqft |
Source: Zillow Rentals Report a problem | ||
| 8/7/2024 | Listed for rent | $4,200$2/sqft |
Source: Zillow Rentals Report a problem | ||
| 6/28/2024 | Sold | $702,000+8.2%$295/sqft |
Source: | ||
| 5/24/2024 | Pending sale | $649,000$272/sqft |
Source: | ||
| 5/15/2024 | Listed for sale | $649,000$272/sqft |
Source: | ||
| Year | Property taxes | Tax assessment |
|---|---|---|
| 2025 | $12,035 +21.9% | $703,400 +21.9% |
| 2024 | $9,869 -1.2% | $576,800 +7.4% |
| 2023 | $9,992 +9.9% | $536,900 +23.7% |
| 2022 | $9,090 +0.3% | $433,900 +9.9% |
| 2021 | $9,062 +1.3% | $394,700 -0.6% |
| 2020 | $8,946 +10.2% | $397,100 +5% |
| 2019 | $8,117 | $378,100 +2.9% |
| 2018 | $8,117 -1.6% | $367,500 +6.2% |
| 2017 | $8,252 +0.1% | $346,100 +2% |
| 2016 | $8,243 -1.1% | $339,300 +1.1% |
| 2015 | $8,339 -0.7% | $335,500 +6.5% |
| 2014 | $8,402 +0.2% | $314,900 |
| 2013 | $8,389 +10.9% | $314,900 |
| 2012 | $7,565 -6.3% | $314,900 -11.3% |
| 2011 | $8,077 +3.9% | $355,000 -7.7% |
| 2010 | $7,777 +2% | $384,800 |
| 2009 | $7,621 | $384,800 0% |
| 2008 | -- | $384,900 |
| 2007 | -- | $384,900 +154.9% |
| 2006 | -- | $151,000 |
| 2005 | -- | $151,000 |
| 2003 | -- | $151,000 |
| 2002 | -- | $151,000 |
| 2001 | -- | $151,000 |
Find assessor info on the county website
Source: MoreMLS. This data may not be complete. We recommend contacting the local school district to confirm school assignments for this home.