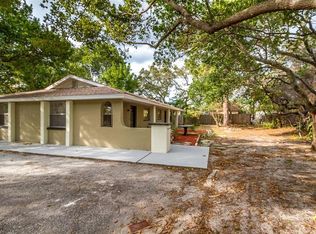
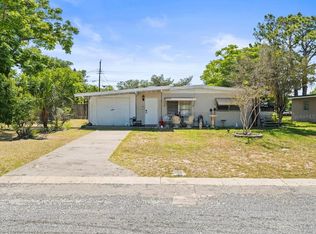
Two bedroom two bath nice neighborhood close to everything very convenient location
Foreclosed
Street View
Est. $149,800
5411 Lemon St, New Port Richey, FL 34652
2beds
852sqft
SingleFamily
Built in 1940
7,492 Square Feet Lot
$149,800 Zestimate®
$176/sqft
$-- HOA
Overview
- 322 days |
- 23 |
- 2 |
Facts & features
Interior
Bedrooms & bathrooms
- Bedrooms: 2
- Bathrooms: 1
- Full bathrooms: 1
Heating
- Other
Cooling
- Central, Wall
Features
- Flooring: Tile, Carpet, Linoleum / Vinyl
- Has fireplace: No
Interior area
- Total interior livable area: 852 sqft
Property
Parking
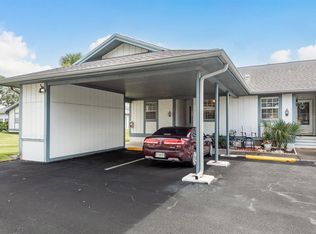
- Parking features: Carport
Features
- Exterior features: Other, Wood
Lot
- Size: 7,492 Square Feet
Details
- Parcel number: 0826160270004000015
Construction
Type & style
- Home type: SingleFamily
Materials
- Roof: Asphalt
Condition
- Year built: 1940
Community & HOA
Location
- Region: New Port Richey
Financial & listing details
- Price per square foot: $176/sqft
- Tax assessed value: $124,622
- Annual tax amount: $2,517
Visit our professional directory to find a foreclosure specialist in your area that can help with your home search.
Find a foreclosure agentForeclosure details
Estimated market value
$149,800
$121,000 - $177,000
$1,684/mo
Price history
| Date | Event | Price |
|---|---|---|
| 10/2/2022 | Listing removed | -- |
Source: Owner Report a problem | ||
| 9/29/2022 | Listed for sale | $90,000+201%$106/sqft |
Source: Owner Report a problem | ||
| 12/7/2001 | Sold | $29,900+19.6%$35/sqft |
Source: Public Record Report a problem | ||
| 1/12/2001 | Sold | $25,000-16.4%$29/sqft |
Source: Public Record Report a problem | ||
| 6/16/1997 | Sold | $29,900$35/sqft |
Source: Public Record Report a problem | ||
Public tax history
| Year | Property taxes | Tax assessment |
|---|---|---|
| 2024 | $2,517 +6.7% | $124,622 +44.1% |
| 2023 | $2,360 +11% | $86,510 +10% |
| 2022 | $2,126 +18.6% | $78,650 +21% |
| 2021 | $1,792 +9.5% | $65,000 +10% |
| 2020 | $1,636 -1.2% | $59,098 -1.2% |
| 2019 | $1,656 | $59,808 +8.9% |
| 2018 | $1,656 +28.7% | $54,945 +25.2% |
| 2017 | $1,287 +10.4% | $43,873 +19.1% |
| 2016 | $1,166 +10.3% | $36,840 +2.6% |
| 2015 | $1,057 +3.6% | $35,895 +2% |
| 2014 | $1,020 | $35,176 +13.9% |
| 2013 | -- | $30,891 -6.7% |
| 2012 | -- | $33,105 -21.5% |
| 2011 | -- | $42,147 -19% |
| 2010 | -- | $52,062 -1.9% |
| 2009 | -- | $53,091 -38.4% |
| 2008 | -- | $86,141 -6.2% |
| 2007 | -- | $91,837 +12.9% |
| 2006 | -- | $81,379 +70.6% |
| 2005 | -- | $47,696 +35% |
| 2004 | -- | $35,318 +2% |
| 2003 | -- | $34,639 +77.2% |
| 2002 | -- | $19,552 +4.3% |
| 2000 | -- | $18,747 |
| 1999 | -- | $18,747 |
Find assessor info on the county website
Monthly payment
Estimated monthly payment$1,822
All calculations are estimates and provided by Zillow, Inc. for informational purposes only. Actual amounts may vary.
HOA fees may include property taxes on listings classified as Co-Ops. Contact the listing agent and/or owner for fee details.
Mortgage interest rates are dependent on a number of factors, including credit score, down payment, and repayment length. Interest rate data provided by Zillow Group Marketplace, Inc. as of 1/1/1970 from various mortgage lenders with which we have lead or other similar arrangements; the Estimated Payment is an average of those rates.
See how much you could borrow to make a competitive offer.
Climate risks
Neighborhood: South River
Nearby schools
GreatSchools rating
- 2/10Richey Elementary SchoolGrades: PK-5Distance: 1.2 mi
- 2/10Gulf Middle SchoolGrades: 6-8Distance: 1 mi
- 3/10Gulf High SchoolGrades: 9-12Distance: 0.8 mi


- Florida
- Pasco County
- New Port Richey
- 34652
- South River
- 5411 Lemon St
Nearby cities
Nearby neighborhoods
Nearby zip codes
Other New Port Richey Topics
