This 2375 square foot single family home has 5 bedrooms and 1.5 bathrooms. This home is located at 5835 Andover Rd, Indianapolis, IN 46220.
Foreclosed
Street View
Est. $396,000
5835 Andover Rd, Indianapolis, IN 46220
5beds
1baths
2,375sqft
SingleFamily
Built in 1958
0.86 Acres Lot
$396,000 Zestimate®
$167/sqft
$-- HOA
Overview
- 84 days
- 53
- 0
Facts & features
Interior
Bedrooms & bathrooms
- Bedrooms: 5
- Bathrooms: 1.5
Heating
- Other
Cooling
- Central
Features
- Has fireplace: Yes
- Fireplace features: masonry
Interior area
- Total interior livable area: 2,375 sqft
Property
Parking
- Total spaces: 3
- Parking features: Garage - Attached
Lot
- Size: 0.86 Acres
Details
- Parcel number: 490704125116000800
Construction
Type & style
- Home type: SingleFamily
Materials
- Stone
- Roof: Asphalt
Condition
- Year built: 1958
Community & HOA
Location
- Region: Indianapolis
Financial & listing details
- Price per square foot: $167/sqft
- Tax assessed value: $438,500
- Annual tax amount: $5,089
Foreclosure details
Estimated market value
$396,000
$345,000 - $451,000
$2,595/mo
Price history
| Date | Event | Price |
|---|---|---|
| 8/6/2026 | Sold | $279,680$118/sqft |
Source: Public Record Report a problem | ||
Public tax history
| Year | Property taxes | Tax assessment |
|---|---|---|
| 2025 | $5,089 +7.6% | $438,500 +16.4% |
| 2024 | $4,730 +6.3% | $376,800 +3.5% |
| 2023 | $4,451 +5.3% | $364,000 +11.6% |
| 2022 | $4,226 +10.6% | $326,300 +3.6% |
| 2021 | $3,823 +24.8% | $315,100 +4.1% |
| 2020 | $3,064 +5.4% | $302,700 +16.2% |
| 2019 | $2,909 +2.4% | $260,400 +2.8% |
| 2018 | $2,840 +8.1% | $253,300 +2.3% |
| 2017 | $2,627 +21.3% | $247,700 +6.7% |
| 2016 | $2,166 +2.3% | $232,100 +8.5% |
| 2014 | $2,117 -5.3% | $213,900 -3.8% |
| 2013 | $2,235 | $222,400 -2.1% |
| 2012 | $2,235 | $227,200 -0.9% |
| 2011 | -- | $229,300 |
| 2010 | $2,117 +7.9% | $229,300 -4.8% |
| 2009 | $1,961 | $240,900 +2.1% |
| 2007 | -- | $235,900 -12.3% |
| 2006 | -- | $269,100 +46.3% |
| 2005 | -- | $184,000 |
| 2004 | -- | $184,000 |
| 2003 | -- | $184,000 +90.9% |
| 2002 | -- | $96,400 +199.9% |
| 2001 | -- | $32,140 |
| 2000 | -- | $32,140 |
Find assessor info on the county website
Monthly payment
Climate risks
Neighborhood: Devonshire
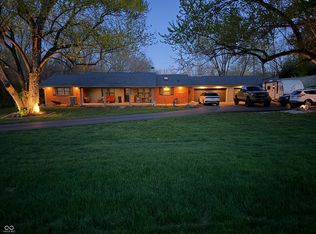
Similar homes
- $345,9003 bd2 ba1.6k sqft2517 Baur Dr, Indianapolis, IN 46220Active
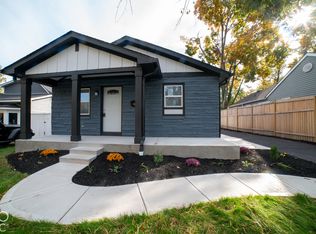 MLS ID #22133258, Marco Garcia, Realty World Indy. MIBOR as distributed by MLS GRID
- $409,0006 bd3 ba2.8k sqft2060 E Thompson Rd, Indianapolis, IN 46227Active
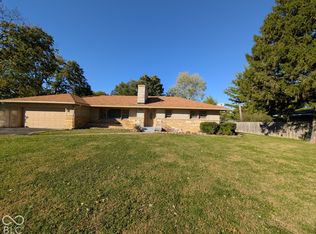 MLS ID #22132338, Barbara Harding, F.C. Tucker Advantage, REALTOR. MIBOR as distributed by MLS GRID
- $399,9002 bd2 ba2.5k sqft5315 N Capitol Ave, Indianapolis, IN 46208Active
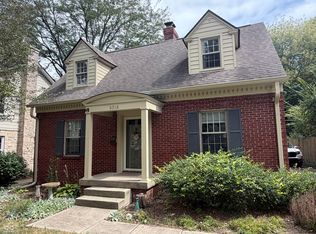 MLS ID #22126088, Ray Stuck, HomeXpert, Ray Stuck & Co.. MIBOR as distributed by MLS GRID
- $--3 bd2 ba1.5k sqft4616 Guilford Ave, Indianapolis, IN 46205Auction
 Auction.com 1
- $359,9004 bd3 ba3.1k sqft5905 W Deerview Bnd, McCordsville, IN 46055For Sale
 MLS ID #847191, Keri Hir, Keri Hir. NIRA as distributed by MLS GRID
