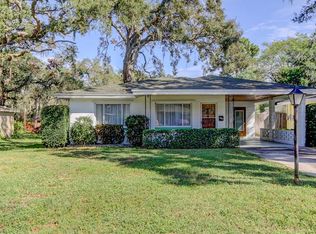
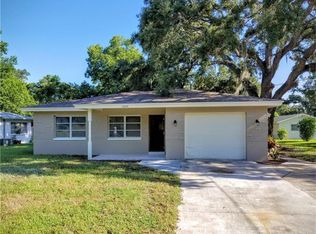
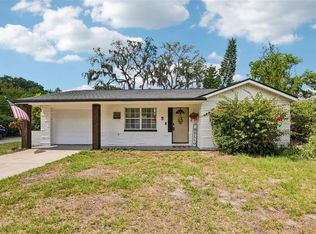
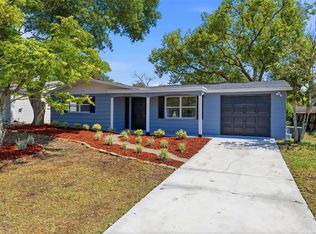
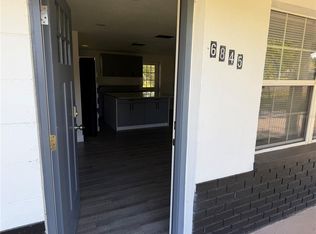
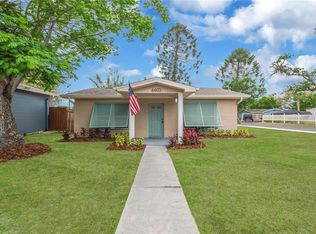
This is a 1086 square foot, 1.0 bathroom, single family home. This home is located at 6123 Tennessee Ave, New Port Richey, FL 34653.
Pre-foreclosure
Street View
Est. $245,700
6123 Tennessee Ave, New Port Richey, FL 34653
--beds
1baths
1,086sqft
SingleFamily
Built in 1963
7,492 Square Feet Lot
$245,700 Zestimate®
$226/sqft
$-- HOA
Overview
- 322 days |
- 9 |
- 1 |
Facts & features
Interior
Bedrooms & bathrooms
- Bathrooms: 1
Heating
- Forced air
Cooling
- Central
Features
- Flooring: Other
Interior area
- Total interior livable area: 1,086 sqft
Property
Features
- Exterior features: Cement / Concrete
Lot
- Size: 7,492 Square Feet
Details
- Parcel number: 0926160030161000140
Construction
Type & style
- Home type: SingleFamily
Materials
- Concrete Block
- Roof: Asphalt
Condition
- Year built: 1963
Community & HOA
Location
- Region: New Port Richey
Financial & listing details
- Price per square foot: $226/sqft
- Tax assessed value: $216,094
- Annual tax amount: $1,031
Visit our professional directory to find a foreclosure specialist in your area that can help with your home search.
Find a foreclosure agentForeclosure details
Estimated market value
$245,700
$219,000 - $270,000
$1,584/mo
Price history
| Date | Event | Price |
|---|---|---|
| 12/31/2008 | Sold | $154,000+116.9%$142/sqft |
Source: Public Record Report a problem | ||
| 8/25/2008 | Sold | $71,000-26.8%$65/sqft |
Source: Public Record Report a problem | ||
| 2/20/2003 | Sold | $97,000+115.6%$89/sqft |
Source: Public Record Report a problem | ||
| 2/5/2002 | Sold | $45,000$41/sqft |
Source: Public Record Report a problem | ||
Public tax history
| Year | Property taxes | Tax assessment |
|---|---|---|
| 2024 | $1,031 +0.7% | $74,110 |
| 2023 | $1,024 +7.2% | $74,110 +5.6% |
| 2022 | $955 +0.6% | $70,180 +6.1% |
| 2021 | $949 +0.4% | $66,160 +1.4% |
| 2020 | $946 +0.9% | $65,250 +2.3% |
| 2019 | $937 | $63,790 +4.1% |
| 2018 | $937 +1.6% | $61,263 |
| 2017 | $922 -0.6% | $61,263 +4.2% |
| 2016 | $927 +9.2% | $58,769 +0.7% |
| 2015 | $849 +0.2% | $58,360 -1% |
| 2014 | $847 | $58,928 +3.3% |
| 2013 | -- | $57,041 -4.8% |
| 2012 | -- | $59,902 -12.2% |
| 2011 | -- | $68,241 -16% |
| 2010 | -- | $81,195 -11.7% |
| 2009 | -- | $91,948 -21.3% |
| 2008 | -- | $116,871 -8.3% |
| 2007 | -- | $127,489 +2.8% |
| 2006 | -- | $123,958 +34.3% |
| 2005 | -- | $92,303 +23.6% |
| 2004 | -- | $74,653 +3.6% |
| 2003 | -- | $72,045 +14.1% |
| 2002 | -- | $63,150 +10% |
| 2000 | -- | $57,391 |
| 1999 | -- | $57,391 |
Find assessor info on the county website
Monthly payment
Estimated monthly payment$1,822
All calculations are estimates and provided by Zillow, Inc. for informational purposes only. Actual amounts may vary.
HOA fees may include property taxes on listings classified as Co-Ops. Contact the listing agent and/or owner for fee details.
Mortgage interest rates are dependent on a number of factors, including credit score, down payment, and repayment length. Interest rate data provided by Zillow Group Marketplace, Inc. as of 1/1/1970 from various mortgage lenders with which we have lead or other similar arrangements; the Estimated Payment is an average of those rates.
See how much you could borrow to make a competitive offer.
Climate risks
Neighborhood: East Madison
Nearby schools
GreatSchools rating
- 2/10Richey Elementary SchoolGrades: PK-5Distance: 0.9 mi
- 2/10Gulf Middle SchoolGrades: 6-8Distance: 0.3 mi
- 3/10Gulf High SchoolGrades: 9-12Distance: 0.8 mi

- Florida
- Pasco County
- New Port Richey
- 34653
- East Madison
- 6123 Tennessee Ave
Nearby cities
Nearby neighborhoods
Nearby zip codes
Other New Port Richey Topics
