$261,700
-- bd|2 ba|1k sqft
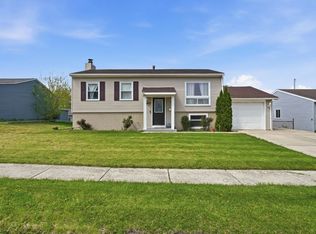
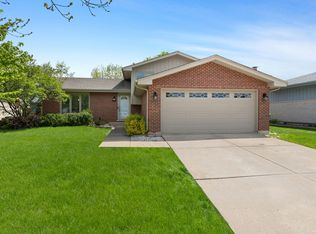
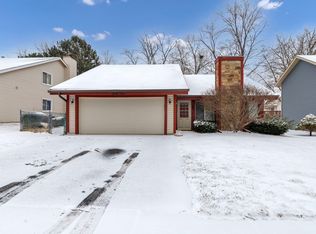
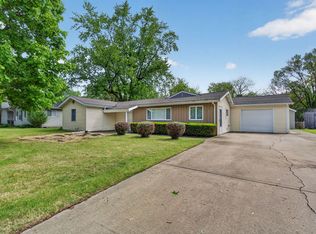
712 Union Ave, Romeoville, IL 60446
Off Market
Zillow last checked:
Listing updated:
Stephanie Herbert 630-272-5161,
RE/MAX Action
$335,400
$319,000 - $352,000
$2,820/mo
| Date | Event | Price |
|---|---|---|
| 4/13/2026 | Contingent | $330,000$201/sqft |
Source: | ||
| 4/9/2026 | Listed for sale | $330,000+50.7%$201/sqft |
Source: | ||
| 1/10/2020 | Listing removed | $1,950$1/sqft |
Source: RE/MAX Action #10587384 Report a problem | ||
| 12/6/2019 | Listed for rent | $1,950$1/sqft |
Source: RE/MAX Action #10587384 Report a problem | ||
| 12/5/2019 | Sold | $219,000-0.4%$134/sqft |
Source: | ||
| 11/13/2019 | Pending sale | $219,900$134/sqft |
Source: Spring Realty #10546121 Report a problem | ||
| 11/13/2019 | Listed for sale | $219,900$134/sqft |
Source: Spring Realty #10546121 Report a problem | ||
| 11/12/2019 | Pending sale | $219,900$134/sqft |
Source: Spring Realty #10546121 Report a problem | ||
| 11/1/2019 | Price change | $219,900-2.2%$134/sqft |
Source: Spring Realty #10546121 Report a problem | ||
| 10/12/2019 | Listed for sale | $224,900+95.6%$137/sqft |
Source: Spring Realty #10546121 Report a problem | ||
| 6/19/2019 | Sold | $115,000$70/sqft |
Source: Public Record Report a problem | ||
| Year | Property taxes | Tax assessment |
|---|---|---|
| 2024 | $7,453 +5.9% | $84,731 +11.1% |
| 2023 | $7,038 +11.5% | $76,238 +13.7% |
| 2022 | $6,310 +4.8% | $67,057 +6.9% |
| 2021 | $6,021 +13.9% | $62,700 +3.4% |
| 2020 | $5,288 +6.5% | $60,638 +7.1% |
| 2019 | $4,965 +8.3% | $56,618 +8.7% |
| 2018 | $4,585 +6.2% | $52,090 +5.5% |
| 2017 | $4,319 +4.3% | $49,374 +5.1% |
| 2016 | $4,139 +12.4% | $47,000 +4.2% |
| 2015 | $3,684 | $45,100 +10% |
| 2014 | $3,684 +3.8% | $41,000 |
| 2013 | $3,551 -1.9% | $41,000 -8.1% |
| 2012 | $3,621 +6.7% | $44,600 -4.5% |
| 2011 | $3,394 -15.6% | $46,700 -21.9% |
| 2010 | $4,019 +6.1% | $59,800 |
| 2009 | $3,788 -0.4% | $59,800 -5.1% |
| 2008 | $3,805 | $63,000 +4.1% |
| 2007 | -- | $60,500 +5% |
| 2006 | $3,701 +6.2% | $57,600 +9.9% |
| 2005 | $3,483 +17.2% | $52,400 +14.9% |
| 2004 | $2,972 +2.7% | $45,600 +4.6% |
| 2003 | $2,892 +16.2% | $43,600 +20.1% |
| 2002 | $2,489 -4.7% | $36,300 |
| 2001 | $2,613 +22% | $36,300 +14.5% |
| 2000 | $2,142 | $31,700 |
Find assessor info on the county website
Source: MRED as distributed by MLS GRID. This data may not be complete. We recommend contacting the local school district to confirm school assignments for this home.
A local agent can set up tours, give advice and negotiate with sellers.