$622,000
4 bd|4 ba|2.8k sqft
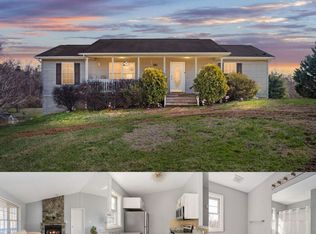
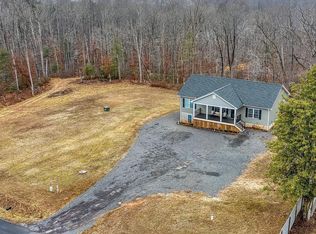
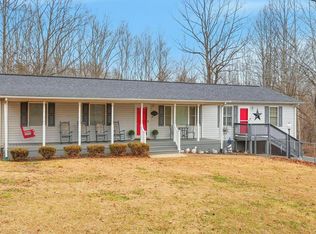
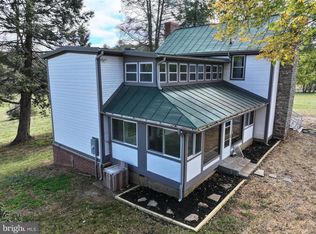
9392 Eggbornsville Rd, Rixeyville, VA 22737
Off Market
Zillow last checked: 7 hours ago
Listing updated: March 19, 2026 at 11:49am
Stanley Heaney 540-812-5533,
Pearson Smith Realty LLC
$590,400
$549,000 - $638,000
$3,174/mo
| Date | Event | Price |
|---|---|---|
| 3/5/2014 | Sold | $264,000-2.2%$104/sqft |
Source: Public Record Report a problem | ||
| 2/1/2014 | Pending sale | $269,900$106/sqft |
Source: Coldwell Banker Elite #CU8211764 Report a problem | ||
| 1/14/2014 | Price change | $269,900-3.6%$106/sqft |
Source: Coldwell Banker Elite #CU8211764 Report a problem | ||
| 12/24/2013 | Price change | $279,900-3.4%$110/sqft |
Source: Coldwell Banker Elite #CU8211764 Report a problem | ||
| 12/10/2013 | Price change | $289,900-3.3%$114/sqft |
Source: Coldwell Banker Elite #CU8211764 Report a problem | ||
| 11/23/2013 | Price change | $299,900-6.3%$118/sqft |
Source: Coldwell Banker Elite #CU8211764 Report a problem | ||
| 10/26/2013 | Listed for sale | $319,900+7%$126/sqft |
Source: Coldwell Banker Elite #CU8211764 Report a problem | ||
| 8/6/2013 | Listing removed | $299,000$118/sqft |
Source: Sam Cachola Broker/Owner Report a problem | ||
| 3/9/2013 | Listed for sale | $299,000+18.6%$118/sqft |
Source: Sam Cachola Broker/Owner Report a problem | ||
| 1/22/2013 | Sold | $252,176+0.9%$99/sqft |
Source: Public Record Report a problem | ||
| 10/26/2012 | Price change | $249,900-16.4%$98/sqft |
Source: Sam Cachola Broker/Owner Report a problem | ||
| 3/10/2012 | Price change | $299,000-8%$118/sqft |
Source: Sam Cachola Broker/Owner Report a problem | ||
| 2/17/2012 | Listed for sale | $325,000-26.3%$128/sqft |
Source: Sam Cachola Broker/Owner Report a problem | ||
| 2/16/2007 | Sold | $441,000$173/sqft |
Source: Public Record Report a problem | ||
| Year | Property taxes | Tax assessment |
|---|---|---|
| 2024 | $2,233 +2.2% | $475,100 |
| 2023 | $2,185 +6.5% | $475,100 +27.3% |
| 2022 | $2,052 | $373,100 |
| 2021 | $2,052 | $373,100 +9.9% |
| 2020 | -- | $339,400 |
| 2019 | -- | $339,400 +5.1% |
| 2018 | -- | $322,800 |
| 2017 | -- | $322,800 +5.4% |
| 2016 | -- | $306,400 |
| 2015 | -- | $306,400 +18% |
| 2014 | $2,156 | $259,700 -8.6% |
| 2012 | -- | $284,100 |
| 2011 | -- | $284,100 -24.8% |
| 2010 | -- | $377,700 |
| 2009 | -- | $377,700 -7.6% |
| 2008 | -- | $408,700 |
| 2006 | -- | $408,700 +989.9% |
| 2005 | -- | $37,500 -55.9% |
| 2004 | -- | $85,000 |
| 2003 | -- | $85,000 +66.7% |
| 2002 | -- | $51,000 |
| 2001 | -- | $51,000 |
Find assessor info on the county website
Source: Bright MLS. This data may not be complete. We recommend contacting the local school district to confirm school assignments for this home.