SHORT SALE - 6,000 Sf 5 BEDROOM 5 BATH COLONIAL IN COLTS NECK . SUBJECT TO SHORT SALE APPROVAL. BUYER RESPONSIBLE FOR CO . HOME IS BEING SOLD STRICTLY AS IS.
For sale
Price cut: $50K (11/17)
$1,450,000
97 Stone Hill Road, Colts Neck, NJ 07722
5beds
5,915sqft
Single Family Residence
Built in 2002
1.27 Acres Lot
$1,438,000 Zestimate®
$245/sqft
$-- HOA
What's special
- 19 hours
- 923
- 67
Zillow last checked:
Listing updated:
Listed by:
Rosanna Dunadee 646-208-1966,
Neuhaus Realty, Inc.,
Joseph Potenza 917-816-1536,
Neuhaus Realty, Inc.
Source: MoreMLS,MLS#: 22636184
Facts & features
Interior
Bedrooms & bathrooms
- Bedrooms: 5
- Bathrooms: 8
- Full bathrooms: 7
- 1/2 bathrooms: 1
Heating
- Other
Cooling
- 3+ Zoned AC
Features
- Ceilings - 9Ft+ 1st Flr, Ceilings - 9Ft+ 2nd Flr, Center Hall, Dec Molding
- Basement: Finished,Full,Walk-Out Access
- Number of fireplaces: 2
Interior area
- Total structure area: 5,915
- Total interior livable area: 5,915 sqft
Property
Parking
- Total spaces: 3
- Parking features: Asphalt, Oversized
- Garage spaces: 3
Features
- Stories: 2
- Exterior features: Swimming
- Has private pool: Yes
- Pool features: Gunite, Heated, In Ground
Lot
- Size: 1.27 Acres
Details
- Parcel number: 1000044010000908
Construction
Type & style
- Home type: SingleFamily
- Architectural style: Custom,Colonial
- Property subtype: Single Family Residence
Materials
- Brick
Condition
- New construction: No
- Year built: 2002
Utilities & green energy
- Water: Well
Community & HOA
Community
- Subdivision: None
HOA
- Has HOA: No
Location
- Region: Colts Neck
Financial & listing details
- Price per square foot: $245/sqft
- Tax assessed value: $1,967,600
- Annual tax amount: $24,674
- Date on market: 11/17/2026
Estimated market value
$1,438,000
$1.37M - $1.51M
$9,490/mo
Price history
| Date | Event | Price |
|---|---|---|
| 11/17/2026 | Price change | $1,450,000-3.3%$245/sqft |
Source:  MoreMLS #22636184 Report a problem | ||
| 6/16/2026 | Listed for sale | $1,499,999-25%$254/sqft |
Source: MoreMLS #22618109 Report a problem | ||
| 12/16/2025 | Price change | $1,999,999-9.1%$338/sqft |
Source: MoreMLS #22532567 Report a problem | ||
| 10/27/2025 | Listed for sale | $2,199,999+112.6%$372/sqft |
Source: MoreMLS #22532567 Report a problem | ||
| 9/1/2021 | Sold | $1,035,000-8.7%$175/sqft |
Source: MoreMLS #22039976 Report a problem | ||
| 7/6/2021 | Price change | $1,133,300-0.5%$192/sqft |
Source: MoreMLS #22039976 Report a problem | ||
| 5/25/2021 | Price change | $1,139,000-0.6%$193/sqft |
Source: MoreMLS #22039976 Report a problem | ||
| 4/14/2021 | Price change | $1,146,100-0.5%$194/sqft |
Source: MoreMLS #22039976 Report a problem | ||
| 3/22/2021 | Price change | $1,151,900-0.5%$195/sqft |
Source: MoreMLS #22039976 Report a problem | ||
| 1/27/2021 | Price change | $1,157,700-1.8%$196/sqft |
Source: MoreMLS #22039976 Report a problem | ||
| 1/19/2021 | Listed for sale | $1,179,000$199/sqft |
Source: MoreMLS #22039976 Report a problem | ||
| 1/13/2021 | Listing removed | -- |
Source:  MoreMLS Report a problem | ||
| 12/17/2020 | Price change | $1,179,000-4.6%$199/sqft |
Source: MoreMLS #22039976 Report a problem | ||
| 10/14/2020 | Price change | $1,235,700+36.4%$209/sqft |
Source: Hubzu Report a problem | ||
| 10/1/2020 | Price change | $906,000+1.6%$153/sqft |
Source: Hubzu Report a problem | ||
| 9/29/2020 | Price change | $891,500+6.6%$151/sqft |
Source: Hubzu Report a problem | ||
| 9/22/2020 | Price change | $836,000-9.9%$141/sqft |
Source: Hubzu Report a problem | ||
| 9/15/2020 | Price change | $928,000+8.2%$157/sqft |
Source: Hubzu Report a problem | ||
| 9/8/2020 | Price change | $858,000-0.8%$145/sqft |
Source: Hubzu Report a problem | ||
| 8/27/2020 | Price change | $865,000-3.7%$146/sqft |
Source: Hubzu Report a problem | ||
| 7/29/2020 | Price change | $898,000-30.7%$152/sqft |
Source: Hubzu Report a problem | ||
| 7/24/2020 | Listed for sale | $1,295,320+129432%$219/sqft |
Source: Hubzu Report a problem | ||
| 5/20/2019 | Sold | $1,000-99.9% |
Source: Public Record Report a problem | ||
| 4/24/2004 | Sold | $1,350,000+58.6%$228/sqft |
Source: Public Record Report a problem | ||
| 4/6/2002 | Sold | $851,250$144/sqft |
Source: Public Record Report a problem | ||
Public tax history
| Year | Property taxes | Tax assessment |
|---|---|---|
| 2026 | $24,674 -6.4% | $1,967,600 +11.2% |
| 2025 | $26,373 +11.3% | $1,770,000 +11.3% |
| 2024 | $23,697 +0.9% | $1,590,400 +5.3% |
| 2023 | $23,492 -1.1% | $1,509,800 +5.6% |
| 2022 | $23,746 -1.2% | $1,429,600 +3.8% |
| 2021 | $24,046 -1.5% | $1,377,200 +2.3% |
| 2020 | $24,404 +32.3% | $1,346,000 -2.9% |
| 2019 | $18,452 | $1,385,800 +0.2% |
| 2018 | $18,452 -23.1% | $1,383,700 +0.2% |
| 2017 | $24,002 -0.3% | $1,381,200 -0.4% |
| 2016 | $24,063 -11% | $1,386,600 0% |
| 2015 | $27,044 +4.3% | $1,386,900 -13.5% |
| 2014 | $25,938 +3.1% | $1,603,100 |
| 2013 | $25,169 +1.2% | $1,603,100 |
| 2012 | $24,864 +0.9% | $1,603,100 |
| 2011 | $24,640 -1.1% | $1,603,100 |
| 2010 | $24,916 +0.6% | $1,603,100 +106.7% |
| 2009 | $24,760 | $775,700 |
| 2008 | -- | $775,700 +3.3% |
| 2007 | -- | $750,600 |
| 2006 | -- | $750,600 |
| 2005 | -- | $750,600 |
| 2003 | -- | $750,600 |
Find assessor info on the county website
Monthly payment
Est. payment
Payment breakdown
Explore the cost of this home by adjusting the details. Changes won't be saved.Climate risks
Neighborhood: 07722
- $1,973,5005 bd-- ba5.4k sqft93 Stone Hill Rd, Colts Neck, NJ 07722Off Market
- $2,333,5005 bd6 ba7.9k sqft101 Stone Hill Rd, Colts Neck, NJ 07722Off Market

- $1,997,3005 bd6 ba7.5k sqft110 Stone Hill Rd, Colts Neck, NJ 07722Off Market
- $2,143,2005 bd-- ba6.2k sqft105 Stone Hill Rd, Colts Neck, NJ 07722Off Market
Similar homes
- $1,375,0005 bd5 ba4.6k sqft31 Palmer Circle, Millstone, NJ 08535For Sale

 MLS ID #22635926, Robert Banjany, Keller Williams Shore Properties. MoreMLS
- $1,799,9005 bd5 ba5.6k sqft5 Ramapo Ct, Colts Neck, NJ 07722For Sale
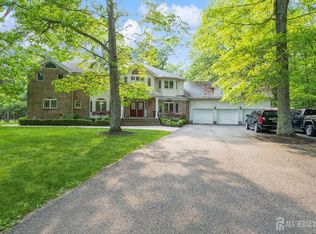
 MLS ID #2700212R, RUPINDER SODHI, WEICHERT CO REALTORS. All Jersey MLS
- $1,285,0005 bd3 ba3.4k sqft21 Cobblestone Way, Freehold, NJ 07728For Sale
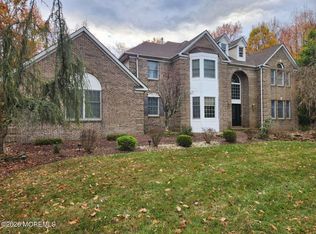 MLS ID #22634875, Qizhan Yao, Realmart Realty LLC.. MoreMLS
- $1,250,0004 bd3 ba4.8k sqft8 Assunpink Trail, Freehold, NJ 07728For Sale
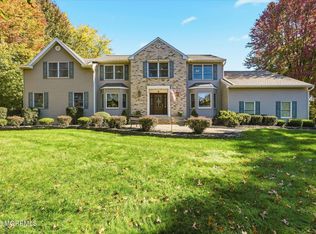 MLS ID #22633688, Colleen Meyler, Compass New Jersey , LLC. MoreMLS
- $1,349,0004 bd4 ba3.1k sqft19 Pease Road, Manalapan, NJ 07726For SaleMLS ID #22634375, Michael Lopez, EXP Realty. MoreMLS
- $1,275,0005 bd4 ba4.5k sqft425 Iron Bridge Road, Freehold, NJ 07728For SaleMLS ID #22620137, Frank Boccuzzi, Castello Realty. MoreMLS
- $1,449,9996 bd4 ba4.5k sqft917 Bethel Church Road, Jackson, NJ 08527For SaleMLS ID #22622162, Anthony Kenney, EXP Realty. MoreMLS
- $2,149,0006 bd5 ba5.1k sqft11 Blueberry Hill, Marlboro, NJ 07746For SaleMLS ID #22635072, Huma Hussain, Realty One Group Central. MoreMLS
- $1,695,0005 bd5 ba4k sqft10 Trotter's Way, Jackson, NJ 08527For SaleMLS ID #22635241, Mikaela Arpino, NJ Real Estate Boutique. MoreMLS
- $1,300,0004 bd4 ba3.8k sqft1 Prince Ct, Jackson, NJ 08527For Sale
 MLS ID #NJOC2046394, Justin Calderon, The Cresi Group LLC. Bright MLS
- $1,239,0004 bd3 ba3.1k sqft74 Macfarlane Cir, Monroe Township, NJ 08831For SaleMLS ID #2707863R, NICHOLAS U. TSELEPIS, NICHOLAS REAL ESTATE AGENCY. All Jersey MLS
- $1,500,0005 bd5 ba4.5k sqft1787 Kathleen Court, Toms River, NJ 08755For SaleMLS ID #22628254, Yosef Segal, Keller Williams Realty Monmouth/Ocean. MoreMLS
- $1,595,0004 bd4 ba3.7k sqft83 Daum Rd, Manalapan, NJ 07726For SaleMLS ID #NJMM2004844, Amy Butewicz, Keller Williams Real Estate - Princeton. Bright MLS
- $1,399,0005 bd5 ba4.1k sqft10 Cherise Court, Jackson, NJ 08527For SaleMLS ID #22631328, Shimon Neustadt, NFL Realty LLC. MoreMLS
- $1,300,0004 bd3 ba3.2k sqft1 Moonlight Court, Millstone, NJ 08510For SaleMLS ID #22634881, Ronnie Glomb, Your Town Realty. MoreMLS
- $1,700,0005 bd5 ba5k sqft24 Bartram Road, Englishtown, NJ 07726For SaleMLS ID #22633095, Roman Balandin, Roman Balandin Realty LLC. MoreMLS
- $1,150,0005 bd4 ba3.6k sqft3 Shira Lane, Manalapan, NJ 07726For SaleMLS ID #22630877, Tracy Cook Burwell, Weichert Realtors-E. Brunswick. MoreMLS
