$19,826
-- bd|-- ba|-- sqft
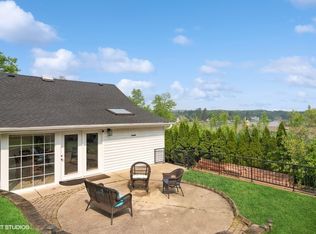
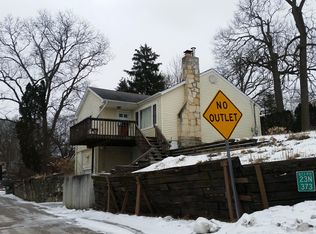
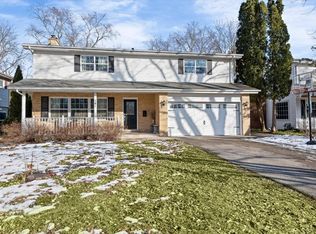
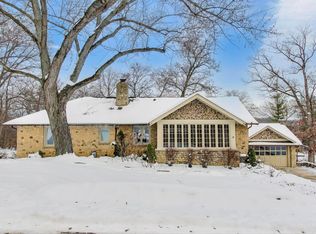
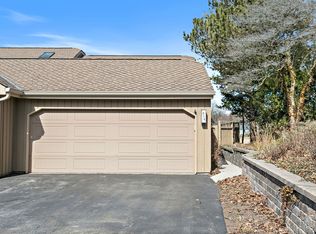
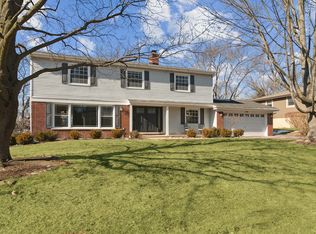
28693 W Ravine Dr, Barrington, IL 60010
Off Market
Zillow last checked: 8 hours ago
Listing updated: February 14, 2026 at 10:07pm
John Herman 630-251-8006,
Property Up Inc.
$619,500
$589,000 - $650,000
$3,855/mo
| Date | Event | Price |
|---|---|---|
| 1/8/2026 | Listed for sale | $635,000+5.8%$250/sqft |
Source: | ||
| 9/8/2025 | Sold | $600,000-5.5%$236/sqft |
Source: | ||
| 7/21/2025 | Contingent | $635,000$250/sqft |
Source: | ||
| 7/2/2025 | Listed for sale | $635,000+27.1%$250/sqft |
Source: | ||
| 2/2/2012 | Listing removed | $2,100$1/sqft |
Source: CENTURY 21 Roberts and Andrews #07871636 Report a problem | ||
| 10/1/2011 | Listing removed | $499,507$197/sqft |
Source: CENTURY 21 Roberts and Andrews #07803643 Report a problem | ||
| 10/1/2011 | Listed for rent | $2,100$1/sqft |
Source: CENTURY 21 Roberts and Andrews #07871636 Report a problem | ||
| 6/28/2011 | Price change | $499,507-5.7%$197/sqft |
Source: Roberts and Andrews #07803643 Report a problem | ||
| 5/13/2011 | Price change | $529,507-3.6%$209/sqft |
Source: Roberts and Andrews #07803643 Report a problem | ||
| 5/12/2011 | Listed for sale | $549,507+119.8%$217/sqft |
Source: CENTURY 21 Roberts and Andrews #07803643 Report a problem | ||
| 8/11/2000 | Sold | $250,000$99/sqft |
Source: Public Record Report a problem | ||
| Year | Property taxes | Tax assessment |
|---|---|---|
| 2023 | $4,811 -15.8% | $108,270 +26.1% |
| 2022 | $5,715 +1.7% | $85,834 -9.2% |
| 2021 | $5,617 +2.8% | $94,539 +2% |
| 2020 | $5,465 +4.4% | $92,644 +2.7% |
| 2019 | $5,234 +10.1% | $90,200 +4.7% |
| 2018 | $4,756 | $86,171 +2% |
| 2017 | $4,756 +1.3% | $84,440 +3.9% |
| 2016 | $4,693 -7.8% | $81,255 +6.6% |
| 2015 | $5,090 +0.3% | $76,210 -3.2% |
| 2014 | $5,076 +3.1% | $78,742 -1.7% |
| 2012 | $4,922 +15.2% | $80,095 -0.8% |
| 2011 | $4,272 -1.5% | $80,750 -8.3% |
| 2010 | $4,337 -0.9% | $88,066 -6.4% |
| 2009 | $4,376 +5.6% | $94,087 |
| 2008 | $4,145 -7.6% | $94,087 +4.9% |
| 2006 | $4,487 +7.9% | $89,666 |
| 2005 | $4,160 +0.8% | -- |
| 2004 | $4,125 +6.2% | -- |
| 2003 | $3,884 +3.3% | -- |
| 2002 | $3,759 +2.2% | -- |
| 2001 | $3,678 +16.2% | $70,921 +4.4% |
| 2000 | $3,164 | $67,925 |
Source: MRED as distributed by MLS GRID. This data may not be complete. We recommend contacting the local school district to confirm school assignments for this home.