$204,700
3 bd|1 ba|1k sqft
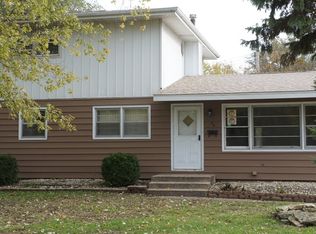
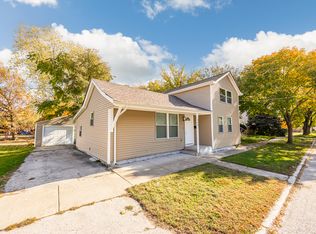
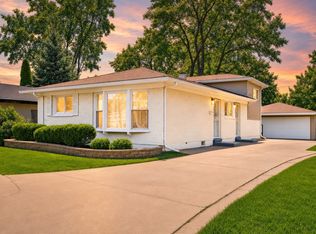
59 Arrowhead Dr, Thornton, IL 60476
Off Market
Zillow last checked:
Lori Spruiell, CSC 708-724-4498,
Baird & Warner
Not available
Estimated sales range
Not available
Not available
| Date | Event | Price |
|---|---|---|
| 6/3/2026 | Listed for sale | $225,000+108.3%$213/sqft |
Source: MRED as distributed by MLS GRID #12623789 Report a problem | ||
| 6/11/2018 | Sold | $108,000-1.7%$102/sqft |
Source: | ||
| 4/24/2018 | Pending sale | $109,900$104/sqft |
Source: Coldwell Banker Residential Brokerage - Flossmoor #09825687 Report a problem | ||
| 4/9/2018 | Price change | $109,900-7.6%$104/sqft |
Source: Coldwell Banker Residential Brokerage - Flossmoor #09825687 Report a problem | ||
| 3/6/2018 | Price change | $118,900-4.8%$113/sqft |
Source: Coldwell Banker Residential Brokerage - Flossmoor #09825687 Report a problem | ||
| 1/4/2018 | Listed for sale | $124,900-12.7%$118/sqft |
Source: Coldwell Banker Residential #09825687 Report a problem | ||
| 5/9/2006 | Sold | $143,000+12.2%$135/sqft |
Source: Public Record Report a problem | ||
| 5/20/2004 | Sold | $127,500+10.9%$121/sqft |
Source: Public Record Report a problem | ||
| 10/5/1998 | Sold | $115,000$109/sqft |
Source: Public Record Report a problem | ||
| Year | Property taxes | Tax assessment |
|---|---|---|
| 2023 | $5,385 +82.3% | $14,003 +74.9% |
| 2022 | $2,955 +3.5% | $8,006 |
| 2021 | $2,854 -0.3% | $8,006 |
| 2020 | $2,862 -51.1% | $8,006 -20.1% |
| 2019 | $5,852 +58.7% | $10,014 |
| 2018 | $3,687 -0.8% | $10,014 |
| 2017 | $3,717 -1.7% | $10,014 +7.5% |
| 2016 | $3,782 +7.8% | $9,317 |
| 2015 | $3,509 +1.9% | $9,317 |
| 2014 | $3,444 -3.1% | $9,317 -11.9% |
| 2013 | $3,555 +0.3% | $10,580 |
| 2012 | $3,543 -1.4% | $10,580 |
| 2011 | $3,595 -5.7% | $10,580 -12.9% |
| 2010 | $3,810 +6.4% | $12,152 |
| 2009 | $3,582 +18.6% | $12,152 -5% |
| 2008 | $3,019 +6.7% | $12,792 +4.3% |
| 2007 | $2,831 +4.6% | $12,267 |
| 2006 | $2,707 +11.2% | $12,267 |
| 2005 | $2,435 -9.8% | $12,267 +5.9% |
| 2004 | $2,701 +0.1% | $11,583 |
| 2003 | $2,698 +1.3% | $11,583 |
| 2002 | $2,664 +10.5% | $11,583 +4.5% |
| 2001 | $2,410 +2% | $11,079 |
| 2000 | $2,364 +13.5% | $11,079 |
| 1999 | $2,083 | $11,079 |
Source: MRED as distributed by MLS GRID. This data may not be complete. We recommend contacting the local school district to confirm school assignments for this home.
A local agent can set up tours, give advice and negotiate with sellers.