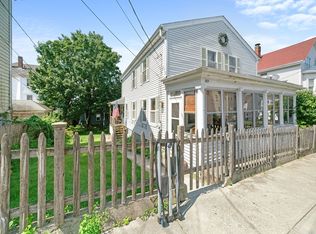
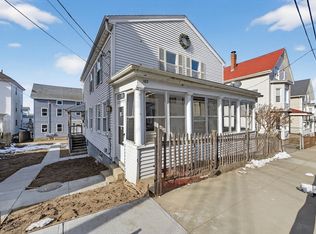
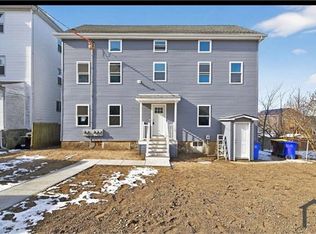
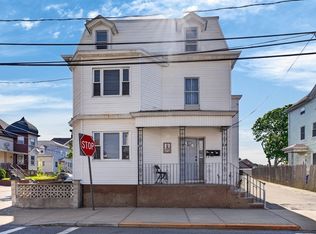
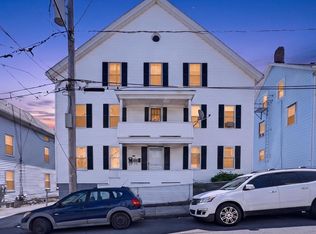
Opportunity knocks with this 3-family! Whether you're an investor looking to expand your portfolio or an owner-occupant searching for strong rental potential, 155 Grant St checks the boxes with several major updates already completed. Big-ticket improvements include a newer roof completed in 2022 and forced hot air systems installed on all 3 floors in 2024, offering peace of mind for years to come. The first and second floor units also feature updated flooring, adding a fresh and modern touch. Additional highlights include a 1-car garage, separate living spaces, and strong income-producing potential. Conveniently located near highways, shopping, restaurants, and local amenities. Don’t miss your chance to own a solid multi-family with important upgrades already done! All tenants are TAW. Open House on Saturday, May 23rd from 3:00-4:00pm.
For sale
$649,900
155 Grant St, Fall River, MA 02721
8beds
3,521sqft
Est.:
3 Family
Built in 1900
-- sqft lot
$650,000 Zestimate®
$185/sqft
$-- HOA
What's special
Separate living spaces
- 1 day |
- 63 |
- 4 |
Zillow last checked:
Listing updated:
Listed by:
Derek Viveiros 774-451-6014,
Amaral & Associates RE 508-674-4972
Source: MLS PIN,MLS#: 73522194
Tour with a local agent
Facts & features
Interior
Bedrooms & bathrooms
- Bedrooms: 8
- Bathrooms: 3
- Full bathrooms: 3
Heating
- Forced Air
Features
- Basement: Full,Walk-Out Access
- Has fireplace: No
Interior area
- Total structure area: 3,521
- Total interior livable area: 3,521 sqft
- Finished area above ground: 3,521
Property
Parking
- Total spaces: 4
- Parking features: Paved Drive
- Garage spaces: 1
- Uncovered spaces: 3
Lot
- Size: 6,717 Square Feet
Details
- Parcel number: M:0G05 B:0000 L:0049,2825877
- Zoning: A-2
Construction
Type & style
- Home type: MultiFamily
- Property subtype: 3 Family
Materials
- Foundation: Granite
Condition
- Year built: 1900
Utilities & green energy
- Sewer: Public Sewer
- Water: Public
Community & HOA
Location
- Region: Fall River
Financial & listing details
- Price per square foot: $185/sqft
- Tax assessed value: $531,900
- Annual tax amount: $6,090
- Date on market: 5/20/2026
- Total actual rent: 5500
Estimated market value
$650,000
$618,000 - $683,000
$1,815/mo
Price history
| Date | Event | Price |
|---|---|---|
| 5/21/2026 | Listed for sale | $649,900+71.5%$185/sqft |
Source: MLS PIN #73522194 Report a problem | ||
| 5/11/2019 | Listing removed | $379,000$108/sqft |
Source: Carolyn A. Burton & Associates #72436344 Report a problem | ||
| 1/3/2019 | Listed for sale | $379,000+196.1%$108/sqft |
Source: Carolyn A. Burton & Associates #72436344 Report a problem | ||
| 7/1/2015 | Sold | $128,000+100%$36/sqft |
Source: Public Record Report a problem | ||
| 11/20/2014 | Listing removed | $64,000$18/sqft |
Source: HomeSearch.com Realty Services Inc #71734794 Report a problem | ||
| 11/14/2014 | Listed for sale | $64,000-87.9%$18/sqft |
Source: HomeSearch.com Realty Services Inc #71734794 Report a problem | ||
| 9/24/2014 | Sold | $527,500+300.2%$150/sqft |
Source: Public Record Report a problem | ||
| 9/16/2014 | Pending sale | $131,800$37/sqft |
Source: J.C. Realty #71734794 Report a problem | ||
| 9/16/2014 | Price change | $131,800+105.9%$37/sqft |
Source: J.C. Realty #71734794 Report a problem | ||
| 9/3/2014 | Price change | $64,000-51.4%$18/sqft |
Source: HomeSearch.com Realty Services Inc #71734794 Report a problem | ||
| 8/28/2014 | Listed for sale | $131,800-64.4%$37/sqft |
Source: J.C. Realty #71734794 Report a problem | ||
| 1/20/2006 | Sold | $370,000+155.2%$105/sqft |
Source: Public Record Report a problem | ||
| 4/27/2000 | Sold | $145,000$41/sqft |
Source: Public Record Report a problem | ||
Public tax history
| Year | Property taxes | Tax assessment |
|---|---|---|
| 2025 | $6,090 +4.4% | $531,900 +4.8% |
| 2024 | $5,832 +16.7% | $507,600 +24.7% |
| 2023 | $4,996 +12.4% | $407,200 +15.6% |
| 2022 | $4,444 +5.9% | $352,100 +16.1% |
| 2021 | $4,195 +11.2% | $303,300 +16.2% |
| 2020 | $3,771 +16.9% | $261,000 +17.9% |
| 2019 | $3,227 +3.8% | $221,300 +4% |
| 2018 | $3,110 +6.3% | $212,700 +1.8% |
| 2017 | $2,925 +1.9% | $208,900 -0.8% |
| 2016 | $2,870 +4.2% | $210,600 |
| 2015 | $2,755 -0.5% | $210,600 -4.4% |
| 2014 | $2,770 +2.1% | $220,200 -3.2% |
| 2013 | $2,714 +3.5% | $227,500 -4.7% |
| 2012 | $2,622 +2% | $238,800 -16% |
| 2010 | $2,570 +3.1% | $284,300 -8.1% |
| 2009 | $2,492 -2.4% | $309,200 -7.1% |
| 2008 | $2,554 +8.4% | $333,000 +1.5% |
| 2007 | $2,356 +14.4% | $328,100 +8.8% |
| 2006 | $2,060 +3.2% | $301,600 +14.9% |
| 2005 | $1,997 +25.9% | $262,400 +35.8% |
| 2004 | $1,586 +9.1% | $193,200 +42.3% |
| 2003 | $1,454 +8.8% | $135,800 |
| 2002 | $1,336 -1.5% | $135,800 +4.8% |
| 2000 | $1,356 +31.4% | $129,600 +15.3% |
| 1995 | $1,032 | $112,400 |
Find assessor info on the county website
Monthly payment
Est. payment$--/mo
Payment breakdown
Explore the cost of this home by adjusting the details. Changes won't be saved.
All calculations are estimates and provided by Zillow, Inc. for informational purposes only. Actual amounts may vary.
HOA fees may include property taxes on listings classified as Co-Ops. Contact the listing agent and/or owner for fee details.
Mortgage interest rates are dependent on a number of factors, including credit score, down payment, and repayment length. Interest rate data provided by Zillow Group Marketplace, Inc. as of 1/1/1970 from various mortgage lenders with which we have lead or other similar arrangements; the Estimated Payment is an average of those rates.
See how much you could borrow to make a competitive offer.
Climate risks
Neighborhood: Sandy Beach
Nearby schools
GreatSchools rating
- 5/10John J Doran Community SchoolGrades: PK-8Distance: 0.2 mi
- 2/10B M C Durfee High SchoolGrades: 9-12Distance: 2.1 mi
- 2/10Matthew J Kuss Middle SchoolGrades: 6-8Distance: 0.9 mi
A local agent can set up tours, give advice and negotiate with sellers.
A local lender can help you make sure your offer is ready when you are.

Nearby cities
Nearby neighborhoods
Nearby zip codes
Other Fall River Topics
