Kent Falls State Park borders property, property has a waterfall on the premises.
finished heated room above the garage, and the garage shop area is insulated an heated. The back patio is 30 feet from a large live water brook. All year round water. 50 25’ mature Norway Spruce tree installations create complete privacy and no other near by properties are visible even in winter. The privacy factor is amazing for a property with water frontage in this area.
For sale by owner
Price cut: $101K (9/27)
$1,199,000
52 Dugan Rd, Kent, CT 06757
3beds
3,340sqft
SingleFamily
Built in 1996
4 Acres Lot
$-- Zestimate®
$359/sqft
$-- HOA
What's special
All year round waterWaterfall on the premises
What the owner loves about this home
2 fireplaces , hardwired propane generator for blackouts, outdoor wood boiler heats both buildings w wood very economical. It also has an oil furnace.
- 69 days
- 501
- 20
Listed by:
Property Owner (203) 788-7479
Facts & features
Interior
Bedrooms & bathrooms
- Bedrooms: 3
- Bathrooms: 3
- Full bathrooms: 2
- 1/2 bathrooms: 1
Heating
- Baseboard, Forced air, Other, Radiant, Stove, Oil, Other, Wood / Pellet
Cooling
- Central
Appliances
- Included: Dishwasher, Dryer, Freezer, Range / Oven, Refrigerator, Washer
Features
- Flooring: Hardwood
- Basement: Partially finished
- Has fireplace: Yes
Interior area
- Total interior livable area: 3,340 sqft
Property
Parking
- Parking features: Garage - Detached
Features
- Exterior features: Wood
- Has view: Yes
- View description: Park, Water, Mountain
- Has water view: Yes
- Water view: Water
Lot
- Size: 4 Acres
Details
- Parcel number: KENTM0014B0021L2
Construction
Type & style
- Home type: SingleFamily
Materials
- Roof: Asphalt
Condition
- New construction: No
- Year built: 1996
Community & HOA
Location
- Region: Kent
Financial & listing details
- Price per square foot: $359/sqft
- Tax assessed value: $497,500
- Annual tax amount: $8,393
- Date on market: 8/11/2026
Estimated market value
Not available
Estimated sales range
Not available
$5,167/mo
Price history
| Date | Event | Price |
|---|---|---|
| 9/27/2026 | Price change | $1,199,000-7.8%$359/sqft |
Source: Owner Report a problem | ||
| 8/11/2026 | Listed for sale | $1,300,000+44.4%$389/sqft |
Source: Owner Report a problem | ||
| 3/24/2021 | Listing removed | -- |
Source: Owner Report a problem | ||
| 12/20/2020 | Listing removed | $900,000$269/sqft |
Source: Owner Report a problem | ||
| 9/21/2020 | Listed for sale | $900,000+5.9%$269/sqft |
Source: Owner Report a problem | ||
| 7/23/2020 | Listing removed | $850,000$254/sqft |
Source: Owner Report a problem | ||
| 4/7/2020 | Listed for sale | $850,000+14.1%$254/sqft |
Source: Owner Report a problem | ||
| 10/7/2005 | Sold | $745,000+52%$223/sqft |
Source: Public Record Report a problem | ||
| 11/17/2000 | Sold | $490,000+28.9%$147/sqft |
Source:  Smart MLS #98081736 Report a problem | ||
| 4/13/1998 | Sold | $380,000$114/sqft |
Source: Public Record Report a problem | ||
Public tax history
| Year | Property taxes | Tax assessment |
|---|---|---|
| 2025 | $8,393 +8.2% | $497,500 |
| 2024 | $7,756 +29.8% | $497,500 +56.2% |
| 2023 | $5,975 +1% | $318,500 |
| 2022 | $5,915 | $318,500 |
| 2021 | $5,915 -0.2% | $318,500 |
| 2020 | $5,927 | $318,500 |
| 2019 | $5,927 +4.8% | $318,500 +4.8% |
| 2018 | $5,657 | $304,000 |
| 2017 | $5,657 +1.5% | $304,000 |
| 2016 | $5,572 +2.6% | $304,000 |
| 2015 | $5,429 +4.9% | $304,000 |
| 2014 | $5,177 +0.9% | $304,000 -14.4% |
| 2013 | $5,131 +1.3% | $355,100 |
| 2012 | $5,067 | $355,100 |
| 2011 | $5,067 +1.8% | $355,100 |
| 2010 | $4,979 -0.6% | $355,100 |
| 2009 | $5,010 -26.6% | $355,100 -2.2% |
| 2008 | $6,825 | $363,200 |
| 2007 | $6,825 +6.9% | $363,200 |
| 2006 | $6,385 +11.1% | $363,200 |
| 2004 | $5,749 +24.9% | $363,200 +65.7% |
| 2003 | $4,603 +5.3% | $219,200 |
| 2001 | $4,373 +9.4% | $219,200 |
| 2000 | $3,996 | $219,200 |
Find assessor info on the county website
Monthly payment
Est. payment
Payment breakdown
Explore the cost of this home by adjusting the details. Changes won't be saved.Climate risks
Neighborhood: 06757
Similar homes
- $1,200,0004 bd4 ba4.2k sqft391 Kent Cornwall Road, Kent, CT 06757For Sale
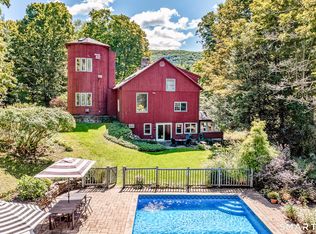
 MLS ID #24207531, Vanessa Henderson, William Pitt Sotheby's Int'l. Smart MLS
- $1,095,0005 bd4 ba2.5k sqft321 Kent Cornwall Road, Kent, CT 06757For Sale
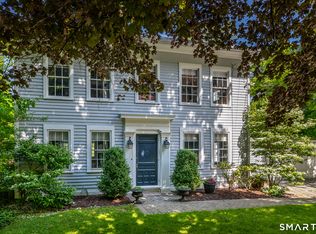 MLS ID #24179592, Stephen Pener, William Pitt Sotheby's Int'l. Smart MLS
- $1,395,0004 bd4 ba2.8k sqft14 Flanders Lane, Kent, CT 06757For Sale
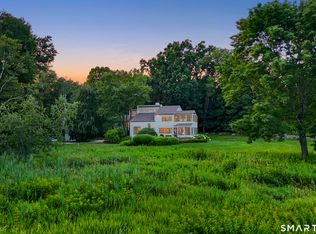 MLS ID #24184750, Stephen Pener, William Pitt Sotheby's Int'l. Smart MLS
- $1,100,0003 bd3 ba2.5k sqft9 Old Paddock Lane, Kent, CT 06757For Sale
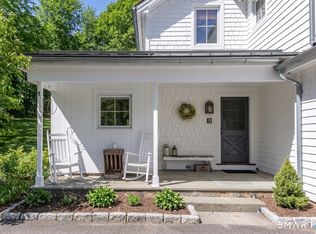 MLS ID #24170157, Stephen Pener, William Pitt Sotheby's Int'l. Smart MLS
- $950,0003 bd3 ba2.4k sqft15 Studio Hill Circle, Kent, CT 06757For SaleMLS ID #24163631, Kim D'andrea, William Pitt Sotheby's Int'l. Smart MLS
- $725,0003 bd3 ba3k sqft12 Woodin Road, Kent, CT 06757For SaleMLS ID #24202166, Deborah M. Bain, Bain Real Estate. Smart MLS
- $1,139,0004 bd4 ba4.4k sqft11 Stone Fences Lane, Kent, CT 06785For SaleMLS ID #24182669, Alan O'Doherty, William Pitt Sotheby's Int'l. Smart MLS
- $1,295,0004 bd3 ba2.9k sqft3 Pine Street, Cornwall, CT 06753For SaleMLS ID #24197707, David Hurlburt, William Pitt Sotheby's Int'l. Smart MLS
- $915,0004 bd3 ba2.3k sqft221 Segar Mountain Road, Kent, CT 06757For SaleMLS ID #24160643, Deborah M. Bain, Bain Real Estate. Smart MLS
- $1,435,0004 bd3 ba2.7k sqft39 Gorham Road, Kent, CT 06785For SaleMLS ID #24196681, Phil Fox, William Pitt Sotheby's Int'l. Smart MLS
- $1,150,0003 bd4 ba4k sqft36 Deer Run Lane, Goshen, CT 06756For SaleMLS ID #24185171, Lisa M. Harrison, E.J. Murphy Realty. Smart MLS
- $1,650,0004 bd5 ba3.7k sqft168 Cobble Road, Kent, CT 06757For SaleMLS ID #24130930, Stephen Pener, William Pitt Sotheby's Int'l. Smart MLS
- $649,9993 bd3 ba2.1k sqft64 Carter Road, Warren, CT 06754For SaleMLS ID #24212904, Jared Tedesco, Litchfield County Real Estate. Smart MLS
- $699,0004 bd4 ba3.5k sqft43 New Preston Hill Road, New Milford, CT 06776For SaleMLS ID #24214153, Denise Kavovit, Compass Connecticut, LLC. Smart MLS
- $1,100,0004 bd4 ba3.5k sqft37 Woodruff Lane, Cornwall, CT 06796For SaleMLS ID #24193100, Diana Bisselle, William Pitt Sotheby's Int'l. Smart MLS
- $950,0003 bd3 ba2.9k sqft104 Lambert Road, Sharon, CT 06069For SaleMLS ID #24177954, Caroline Bailey, Coldwell Banker Realty. Smart MLS
- $985,0003 bd3 ba3.2k sqft28 Headquarters Road, Litchfield, CT 06759For SaleMLS ID #24061045, L. Cleveland Fuessenich, Klemm Real Estate Inc. Smart MLS
- $1,000,0004 bd4 ba3.1k sqft6 Kubish Road, Litchfield, CT 06759For SaleMLS ID #24214625, Alan O'Doherty, William Pitt Sotheby's Int'l. Smart MLS
- $1,399,0003 bd3 ba4k sqft108 Squire Hill Road, New Milford, CT 06776For SaleMLS ID #24203561, Chris Garrity, Bain Real Estate. Smart MLS
- $1,100,0003 bd2 ba1.7k sqft159 Merryall Road, New Milford, CT 06776For SaleMLS ID #24201121, David White, OwnerEntry.com. Smart MLS
