This 1729 square foot single family home has 3 bedrooms and 2.0 bathrooms. This home is located at 8925 Napa Loop, New Port Richey, FL 34653.
Pre-foreclosure
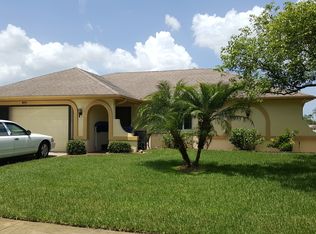
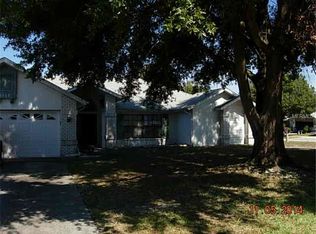
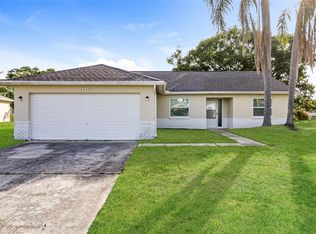
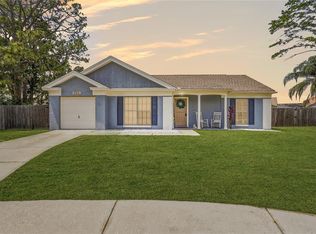
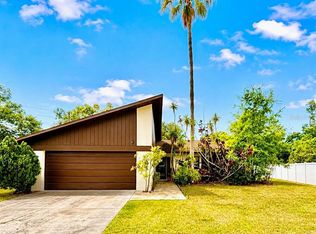
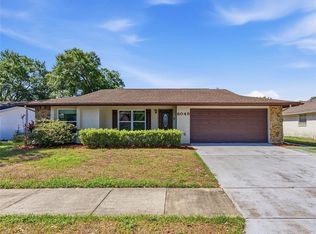
Street View
Est. $363,400
8925 Napa Loop, New Port Richey, FL 34653
3beds
1,729sqft
SingleFamily
Built in 1988
0.29 Acres Lot
$363,400 Zestimate®
$210/sqft
$-- HOA
Overview
- 254 days |
- 28 |
- 1 |
Facts & features
Interior
Bedrooms & bathrooms
- Bedrooms: 3
- Bathrooms: 2
- Full bathrooms: 2
Heating
- Heat pump, Electric
Cooling
- Central
Appliances
- Included: Dishwasher, Dryer, Freezer, Garbage disposal, Microwave, Range / Oven, Refrigerator, Washer
Features
- Flooring: Tile, Carpet
Interior area
- Total interior livable area: 1,729 sqft
Property
Parking
- Parking features: Garage - Attached
Features
- Exterior features: Stucco
- Has spa: Yes
- Has view: Yes
- View description: Water
- Has water view: Yes
- Water view: Water
Lot
- Size: 0.29 Acres
Details
- Parcel number: 142616009000D001800
Construction
Type & style
- Home type: SingleFamily
Materials
- Concrete Block
- Roof: Asphalt
Condition
- Year built: 1988
Community & HOA
Location
- Region: New Port Richey
Financial & listing details
- Price per square foot: $210/sqft
- Tax assessed value: $326,735
- Annual tax amount: $1,727
Visit our professional directory to find a foreclosure specialist in your area that can help with your home search.
Find a foreclosure agentForeclosure details
Estimated market value
$363,400
$331,000 - $392,000
$2,665/mo
Price history
| Date | Event | Price |
|---|---|---|
| 12/1/1988 | Sold | $77,900$45/sqft |
Source: Agent Provided Report a problem | ||
Public tax history
| Year | Property taxes | Tax assessment |
|---|---|---|
| 2024 | $1,727 +4.4% | $128,260 |
| 2023 | $1,655 +11.9% | $128,260 +3% |
| 2022 | $1,479 +2.6% | $124,530 +6.1% |
| 2021 | $1,441 +2.5% | $117,390 +1.4% |
| 2020 | $1,406 +2.4% | $115,770 +2.3% |
| 2019 | $1,373 | $113,170 +1.9% |
| 2018 | $1,373 +2.4% | $111,065 |
| 2017 | $1,341 +0.8% | $111,065 +4.2% |
| 2016 | $1,329 +3.4% | $106,544 +0.7% |
| 2015 | $1,286 +3.1% | $105,803 -19.5% |
| 2014 | $1,247 | $131,491 +26.9% |
| 2013 | -- | $103,613 +1.9% |
| 2012 | -- | $101,683 -14.1% |
| 2011 | -- | $118,338 +3.3% |
| 2010 | -- | $114,610 -10.9% |
| 2009 | -- | $128,660 -28% |
| 2008 | -- | $178,650 -5.9% |
| 2007 | -- | $189,755 +5.2% |
| 2006 | -- | $180,437 +22.5% |
| 2005 | -- | $147,240 +19.7% |
| 2004 | -- | $123,058 +12.5% |
| 2003 | -- | $109,408 +5.7% |
| 2002 | -- | $103,500 +17.3% |
| 2000 | -- | $88,224 |
| 1999 | -- | $88,224 |
Find assessor info on the county website
Monthly payment
Estimated monthly payment$1,822
All calculations are estimates and provided by Zillow, Inc. for informational purposes only. Actual amounts may vary.
HOA fees may include property taxes on listings classified as Co-Ops. Contact the listing agent and/or owner for fee details.
Mortgage interest rates are dependent on a number of factors, including credit score, down payment, and repayment length. Interest rate data provided by Zillow Group Marketplace, Inc. as of 1/1/1970 from various mortgage lenders with which we have lead or other similar arrangements; the Estimated Payment is an average of those rates.
See how much you could borrow to make a competitive offer.
Climate risks
Neighborhood: 34653
Nearby schools
GreatSchools rating
- 6/10Deer Park Elementary SchoolGrades: PK-5Distance: 0.6 mi
- 5/10River Ridge Middle SchoolGrades: 6-8Distance: 4 mi
- 5/10River Ridge High SchoolGrades: PK,9-12Distance: 4 mi

- Florida
- Pasco County
- New Port Richey
- 34653
- 8925 Napa Loop
Nearby cities
Nearby neighborhoods
Nearby zip codes
Other New Port Richey Topics
