$479,000
- Studio
- 1 bath
- 479 sqft
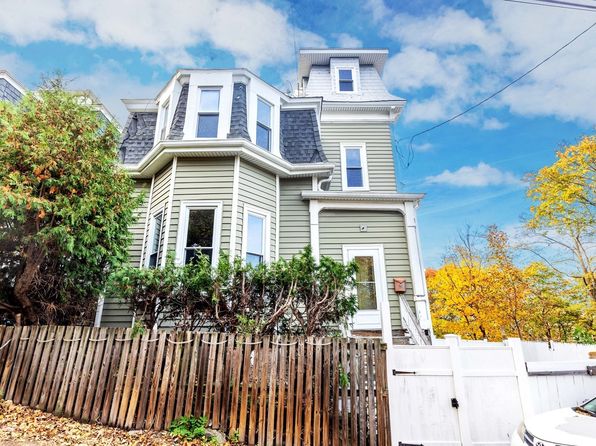
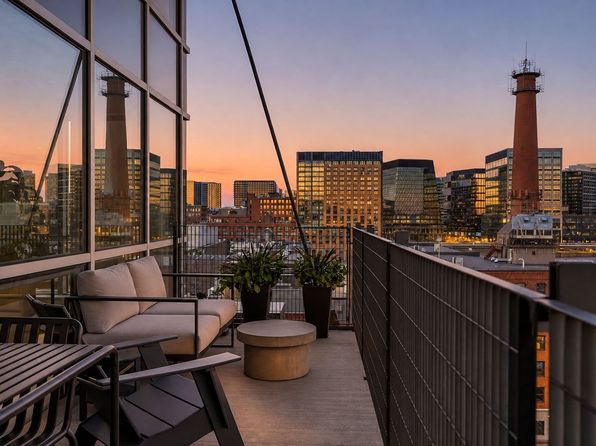
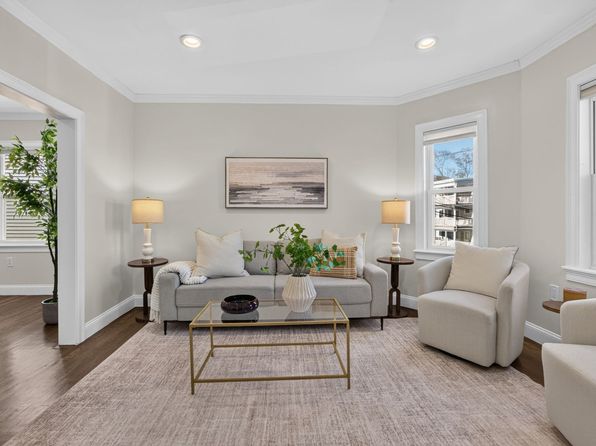
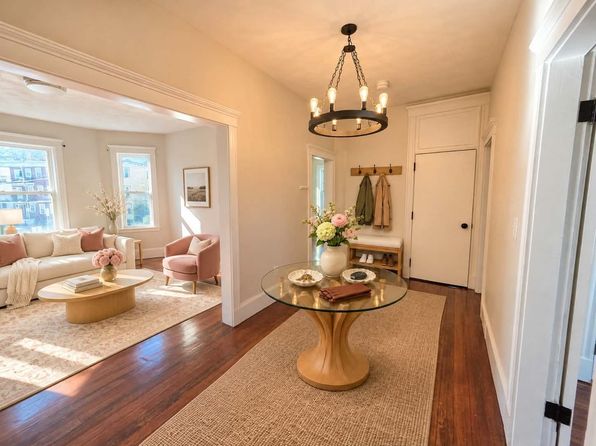
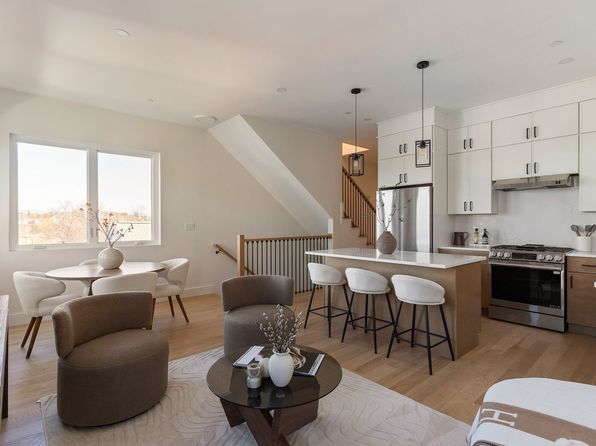
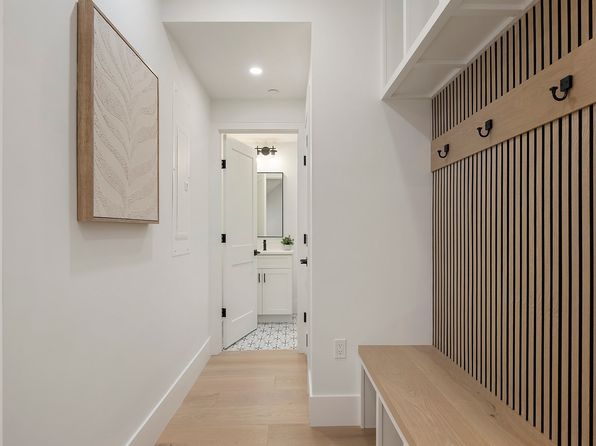
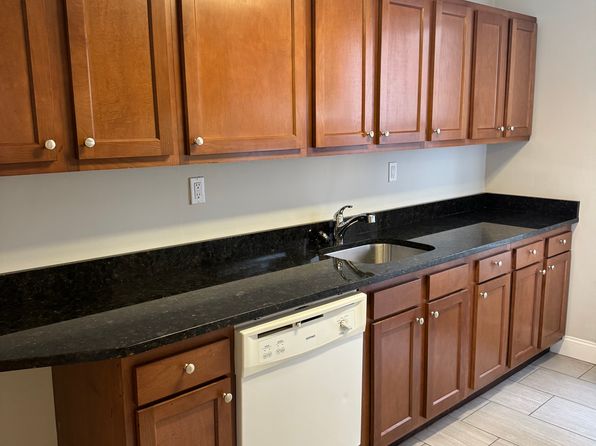
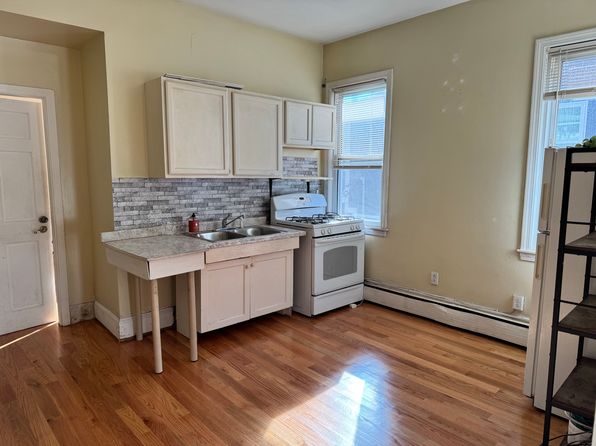
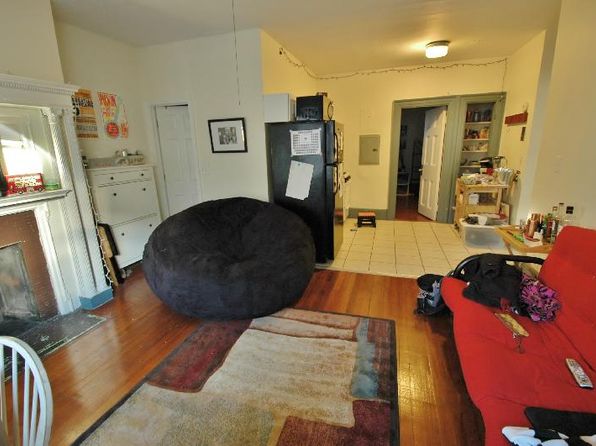
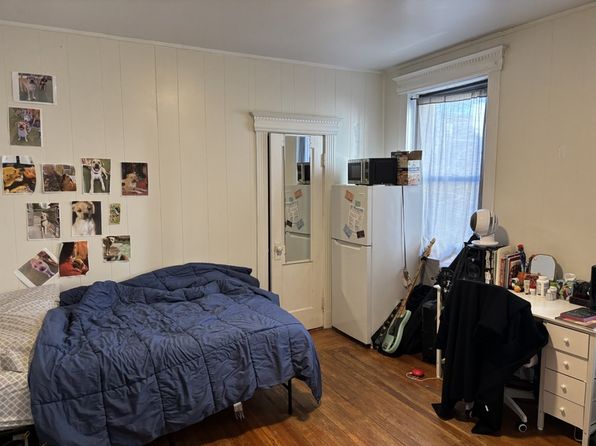
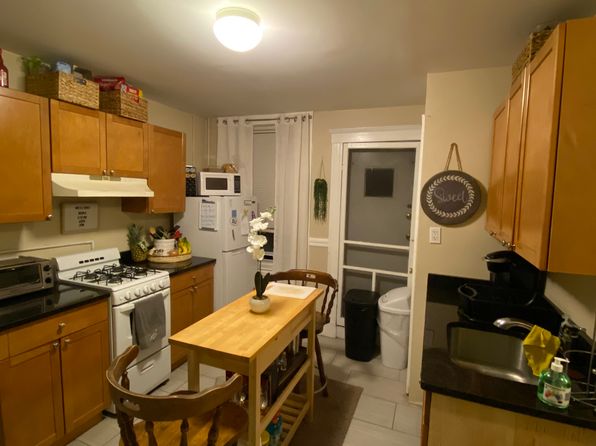
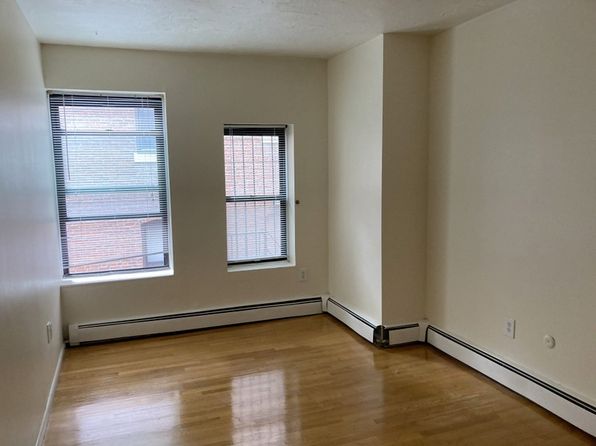
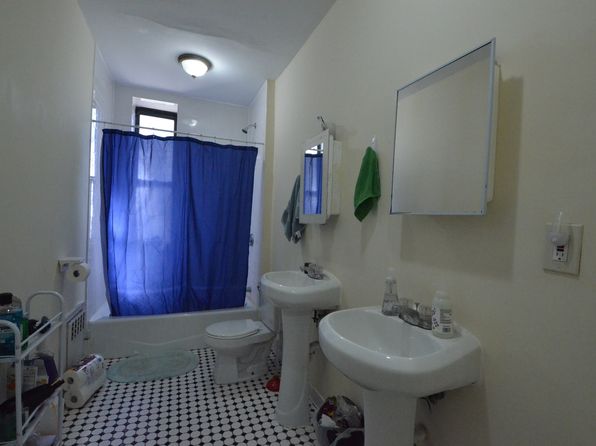
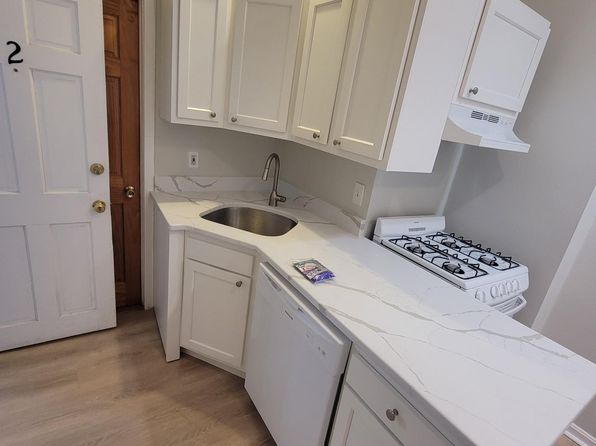
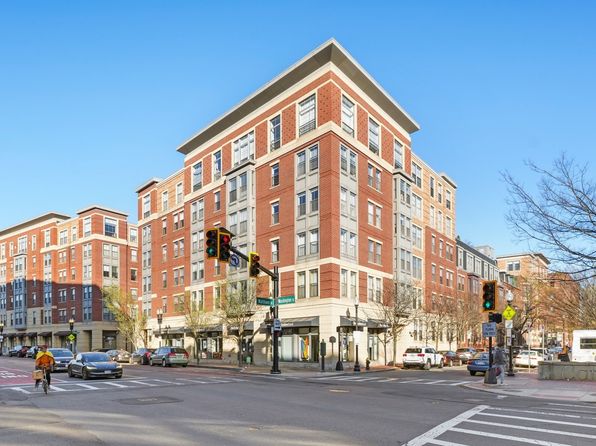
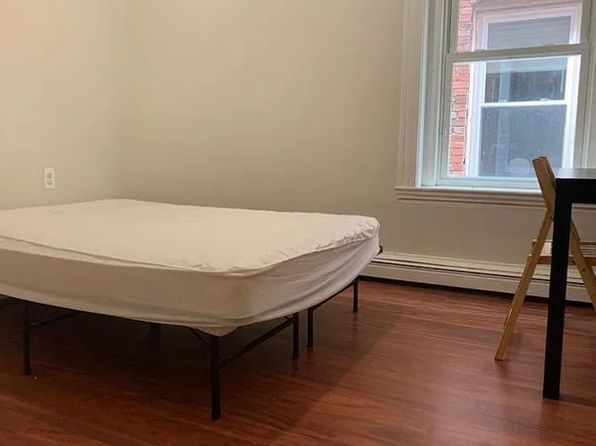
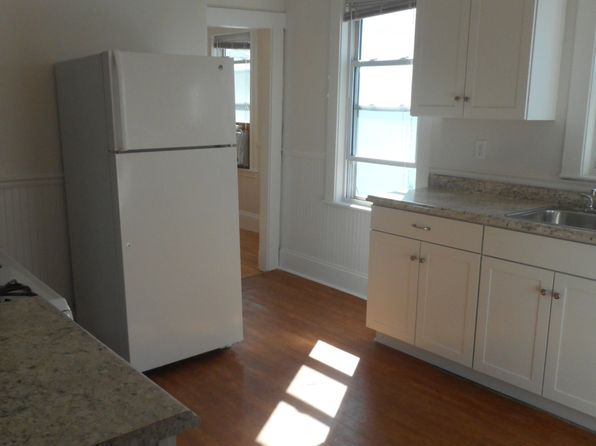
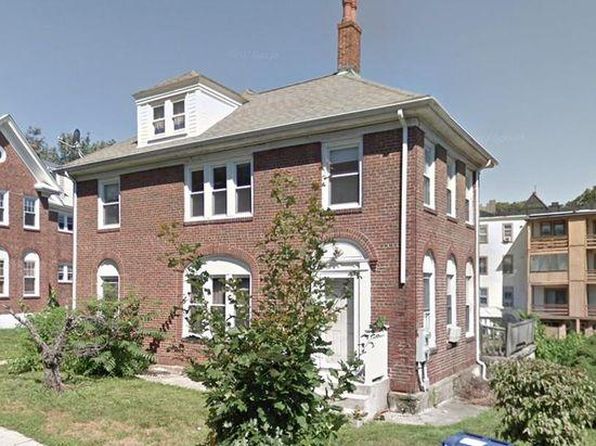
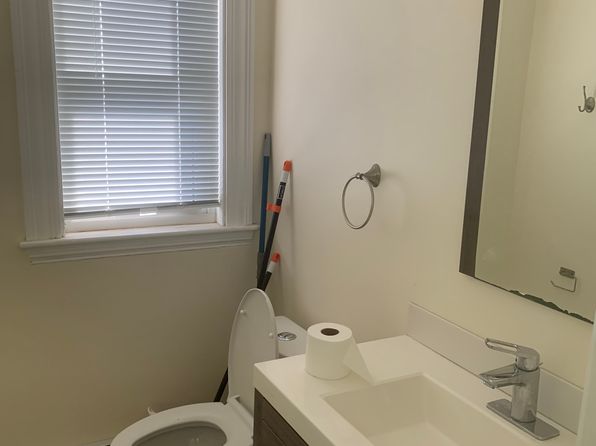
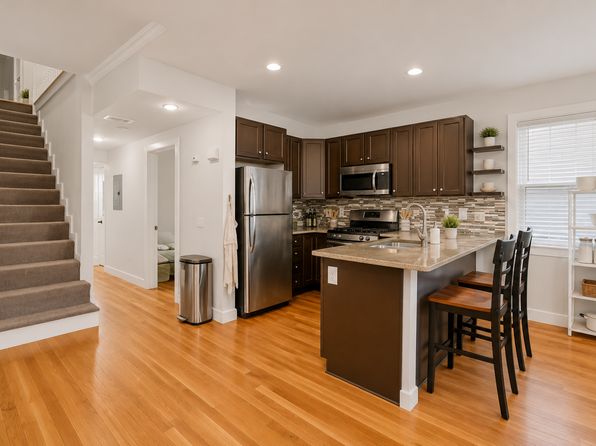
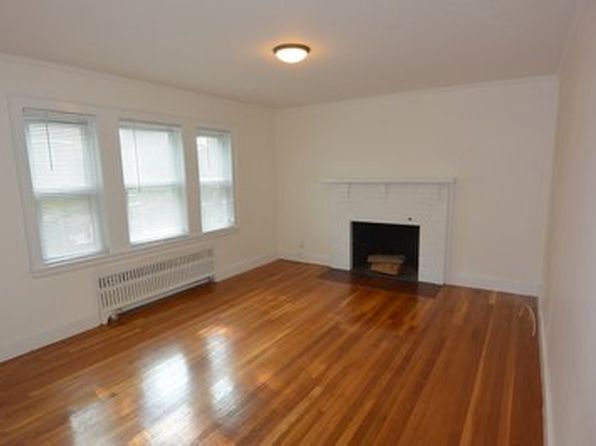
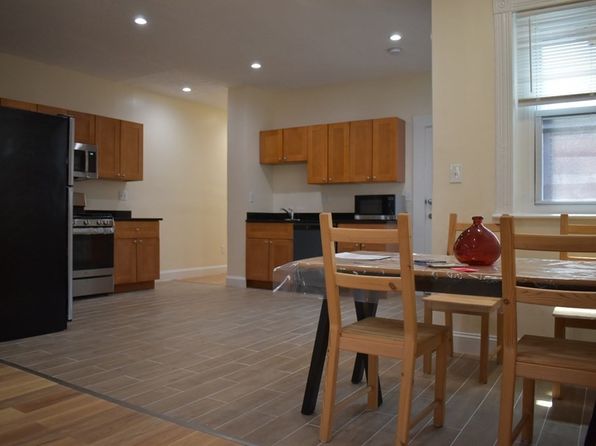
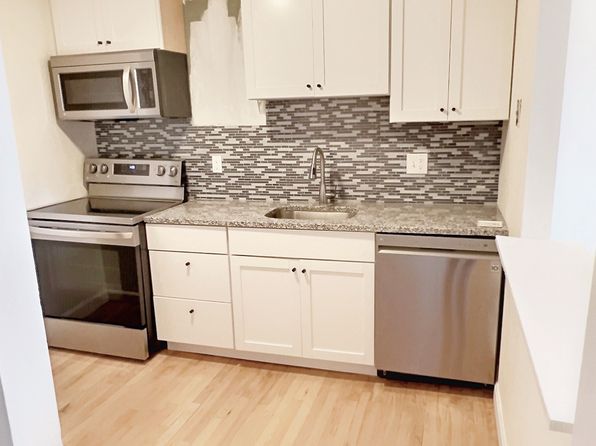
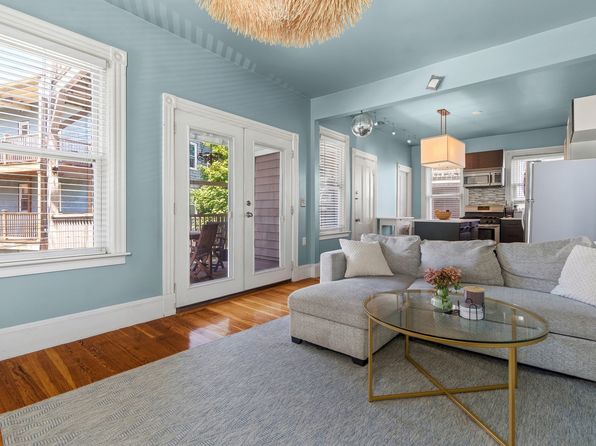
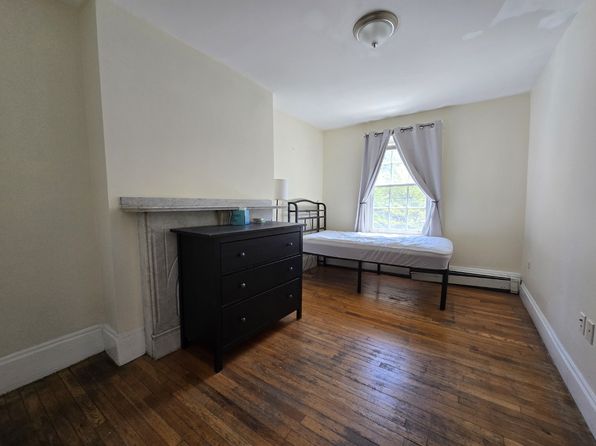
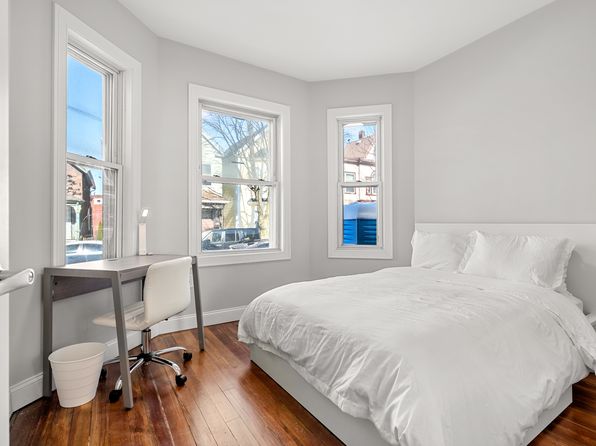
Studio Plan, 2 Maverick Sq, East Boston, MA 02128

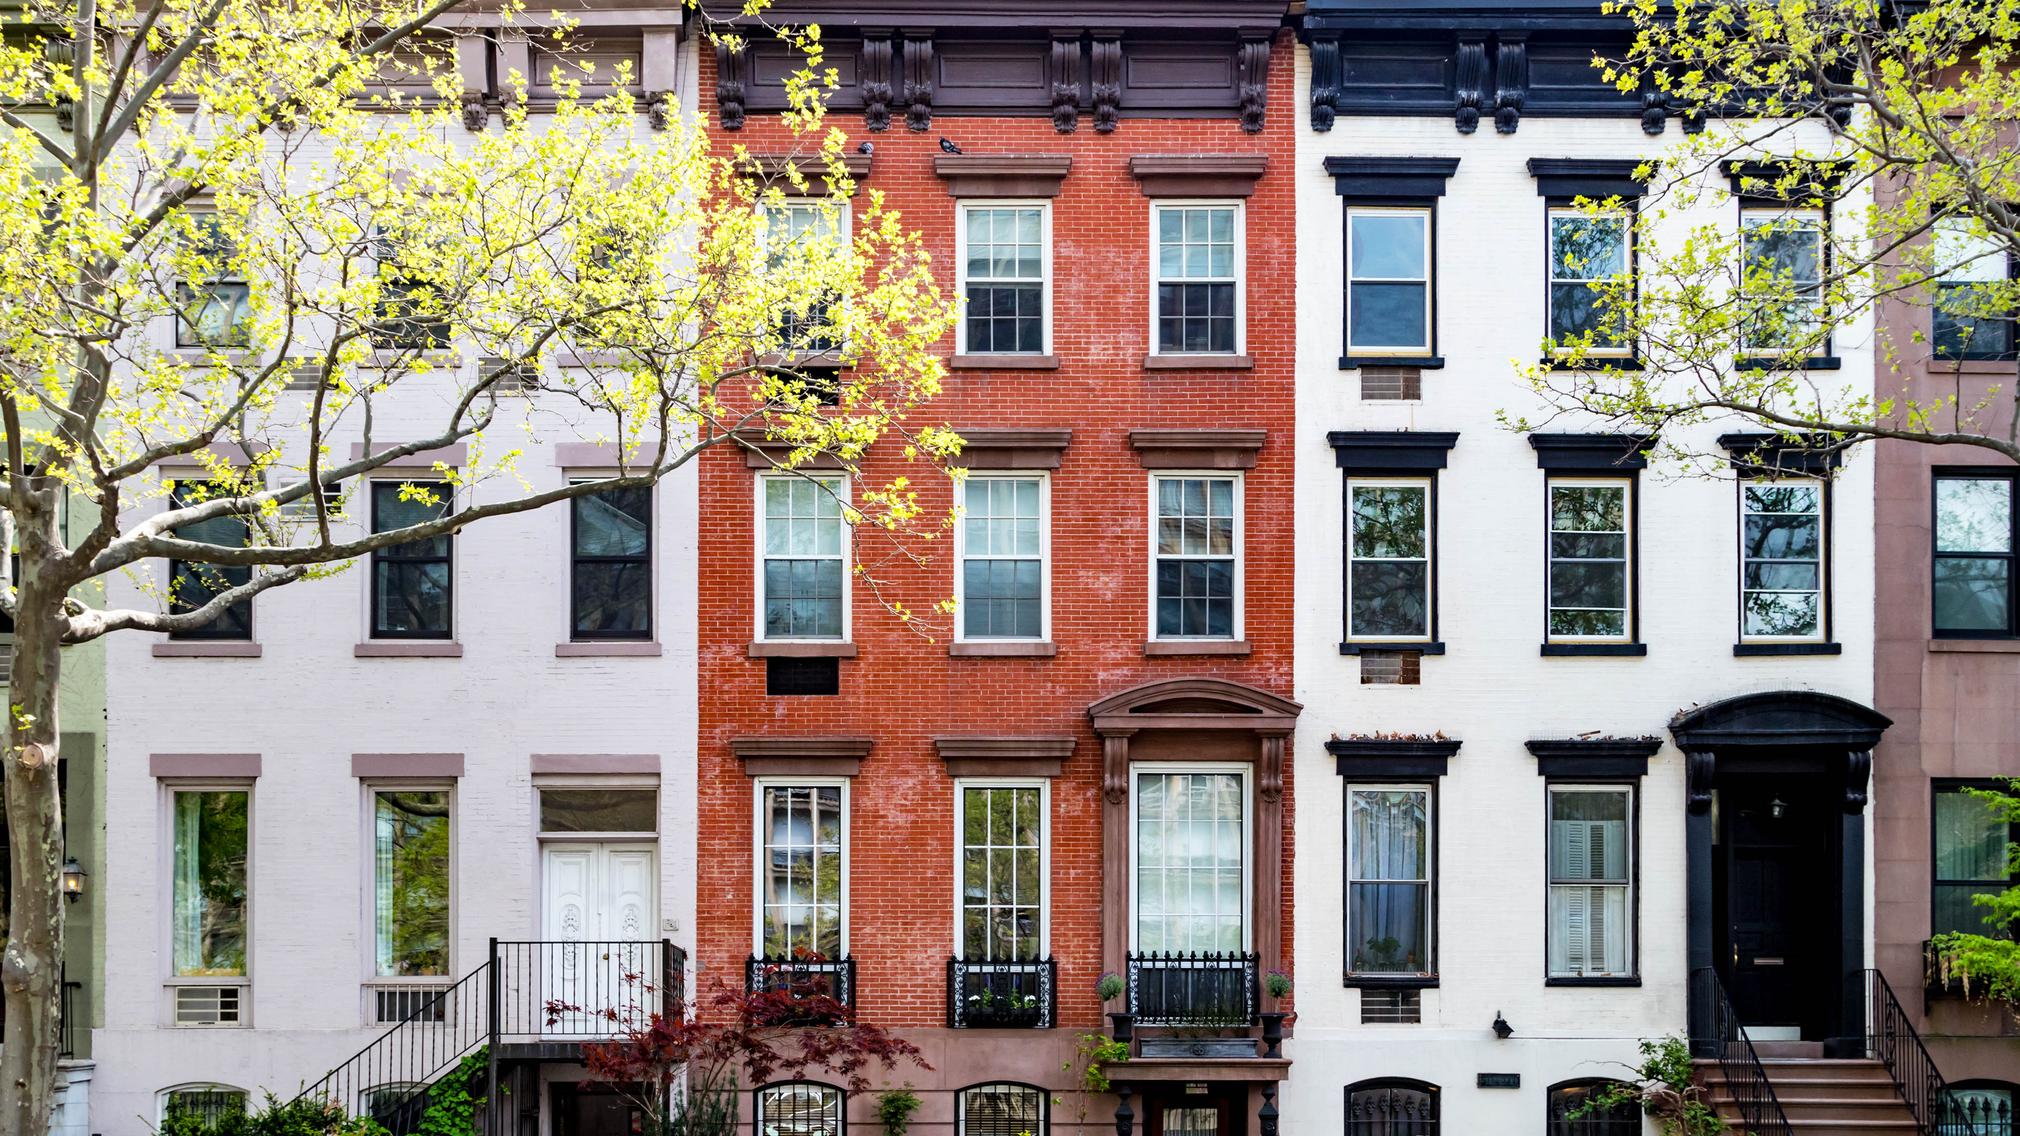
Boston is a coastal city in Massachusetts, with Boston Harbor to the east and the Charles River along part of its northern edge. Its physical character shifts from narrow streets and brick buildings in Beacon Hill and the North End to larger commercial blocks downtown and waterfront development in the Seaport. Boston Common and the Public Garden provide open space beside the downtown street network.
Housing includes historic rowhouses, apartments in converted buildings, triple-deckers, detached houses, and newer condominium towers. Back Bay is known for brownstone streetscapes, while Dorchester and Jamaica Plain contain a mix of wood-frame houses and multifamily buildings. Prices vary by location, building type, size, and condition. Boston’s average home value is $772,405, down 2.1% over the past twelve months; average rent is $3,335/mo, up 2.8% over the same period.
Within the Boston-Cambridge-Newton metro area, Boston has subway, bus, commuter rail, and ferry connections operated by the MBTA. South Station and North Station are major transportation hubs, while Logan International Airport is in East Boston. Many central neighborhoods have closely spaced destinations and sidewalks, though travel options and walking distances vary across the city. Downtown, Back Bay, and the Longwood Medical Area are major employment destinations.
Recreation and cultural amenities include the Charles River Esplanade, Franklin Park, and the Arnold Arboretum. The Museum of Fine Arts and Boston Public Library’s Central Library add major cultural destinations. Neighborhood commercial streets, including Newbury Street and Centre Street in Jamaica Plain, combine shops, dining, and everyday services.
How sale and rent prices have moved over time, and where Boston sits today.
Average home value in Boston, Massachusetts, is $772,405, down 2.1% over the past 12 months. As a buyer, you’re seeing lower home values than a year ago. To plan your budget, aim to keep your mortgage payments at or below 28% of your gross monthly income—your income before taxes.
Average rent in Boston, Massachusetts, is $3,335/mo, up 2.8% over the past 12 months. As a renter, you’re seeing higher rents than a year ago. To plan your budget, aim to spend no more than 30% of your gross monthly income—your income before taxes—on rent.
Boston's market temperature is below Cambridge's and Quincy's, so buyers face less competitive for-sale conditions than in those two markets. Homes in Boston spend an average of 28 days on market, a fast for-sale pace that calls for buyers to prepare before making an offer. Boston also has the largest for-sale inventory among these markets, so buyers have more listings to choose from.
| Region | Average home value | Inventory | Days on market | Competitiveness | Key driver |
|---|---|---|---|---|---|
| Boston | $772,405 | High | 28 days | Lower | Cool temperature; broad selection |
| Medford | $811,246 | Low | 22 days | Lower | Cool temperature; 152 active listings |
| Somerville | $911,858 | Low | 21 days | Lower | Cool temperature; 190 active listings |
| Quincy | $673,571 | Moderate | 14 days | Moderate | Warmer temperature; 223 active listings |
| Cambridge | $1,038,098 | High | 22 days | Moderate | Warmer temperature; 233 active listings |
Boston has excess supply while Quincy is balanced, so renters face less competitive conditions in Boston than in Quincy. Boston draws more renter interest per listing than Medford, Somerville and Cambridge, so renters may find less room to negotiate than in those other excess-supply markets. Boston has the largest rental selection, with an average active rental listing age of 64 days, so renters have more options to browse.
| Region | Average rent | Inventory | Average listing age | Competitiveness | Key driver |
|---|---|---|---|---|---|
| Boston | $3,335/mo | High | 64 days | Lower | Excess supply; broad rental selection |
| Medford | $3,667/mo | Low | 44 days | Lower | Excess supply; 1,148 active rentals |
| Somerville | $3,410/mo | High | 55 days | Lower | Excess supply; 2,415 active rentals |
| Quincy | $2,656/mo | Low | 37 days | Moderate | Balanced; strongest renter interest per listing |
| Cambridge | $3,344/mo | Moderate | 61 days | Lower | Excess supply; 2,294 active rentals |
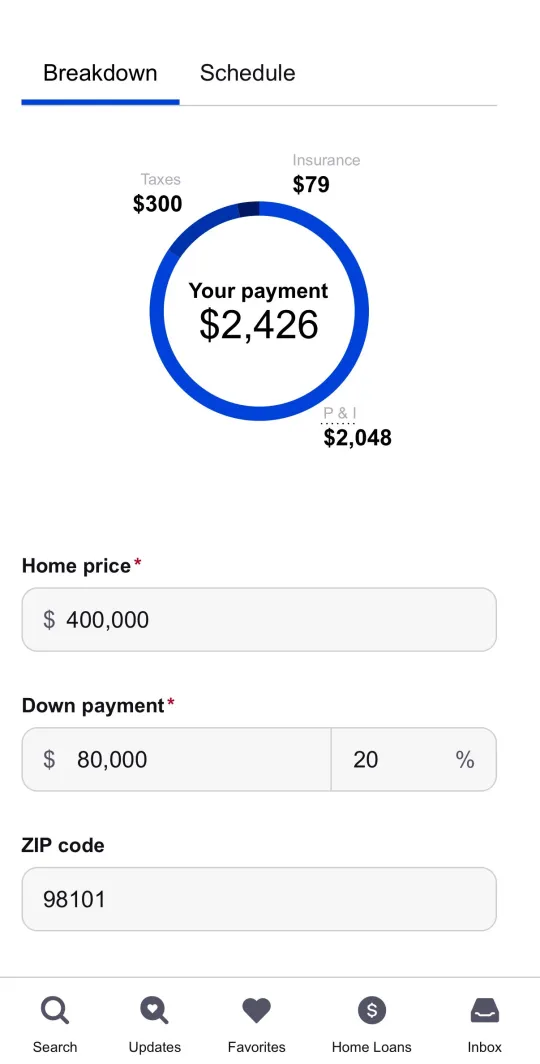
Estimate what it takes to own in this area. Zillow's mortgage calculator helps buyers understand their potential monthly payment-including principal, interest, taxes, and insurance-so they can quickly gauge what home prices fit their budget in this market. Adjust key factors like down payment and interest rate to see how affordability changes and confidently move into your home search.
Not sure whether to rent or buy in this community? This tool compares the long-term costs of both options and shows your breakeven point: the time it takes for buying to become more affordable than renting. Use it to understand how local home prices, rents, and your timeline impact the smarter financial move before starting your search.

See what you can comfortably afford to rent in this area. By factoring in your income, budget, and expenses, Zillow's rent affordability tools help you set a realistic price range-so you can focus on listings that fit your lifestyle and avoid stretching beyond your means as you explore rentals in this market.

Boston's average sale price falls between Quincy and Cambridge, while its monthly rent is below most cities compared here. Its historic downtown and harborfront distinguish its urban setting, with walkable districts connected by an extensive transit network.
| Metric | Boston | Medford | Somerville | Quincy | Cambridge |
|---|---|---|---|---|---|
Average sale priceExplore price per property type | $820,500 | $788,667 | $890,500 | $679,150 | $963,333 |
Average rent priceExplore price per unit size | $3,335/mo | $3,667/mo | $3,410/mo | $2,656/mo | $3,344/mo |
Transit access | Extensive subway and bus connections | Green Line and bus connections | Red/Green lines and bus connections | Red Line and commuter rail | Red/Green lines and bus connections |
Neighborhood vibe | Dense blocks and historic rowhouses | Woodland edges and residential blocks | Compact blocks and multifamily homes | Coastal stretches and mixed housing | Historic squares and dense blocks |
Top POIs | Boston Common (Park); Boston Public Garden (Garden) | Tufts Park (Park); Middlesex Fells Reservation (Nature Reserve) | Prospect Hill Park (Park); Nathan Tufts Park (Park) | Wollaston Beach (Beach); Quincy Quarries Reservation (Park) | Cambridge Common (Park); Fresh Pond Reservation (Nature Reserve) |
Start shopping for homes in Boston. Find 1,732 homes for sale and 14,868 homes for rent in Boston. (Listing data as of )









Buying a house can be a complicated, stressful process. Here are 10 steps to help you confidently find your new home.
Knowing how to find an apartment in a competitive rental market can save you time and money. Use our tips to make your search easier.
When it comes to advice about buying a home, agents have first-hand knowledge. Four partner agents share their top 21 home buying tips.
Learn more about what’s involved in renting a house to own it – and what to watch out for.