$449,000
- 2 beds
- 1 bath
- 825 sqft
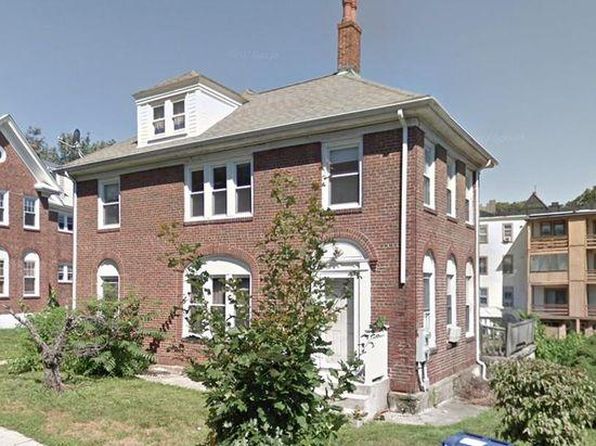
173 Lake Shore Rd APT 3, Brighton, MA 02135
REMAX Andrew Realty Services
Brighton is a neighborhood in western Boston, Massachusetts, within the Boston-Cambridge-Newton metro area. Its physical character shifts between busy commercial streets and quieter residential blocks, with hills adding variety to the street grid. Brighton Center and Oak Square form distinct commercial nodes, while Washington Street connects shops, restaurants, and residential stretches across the neighborhood.
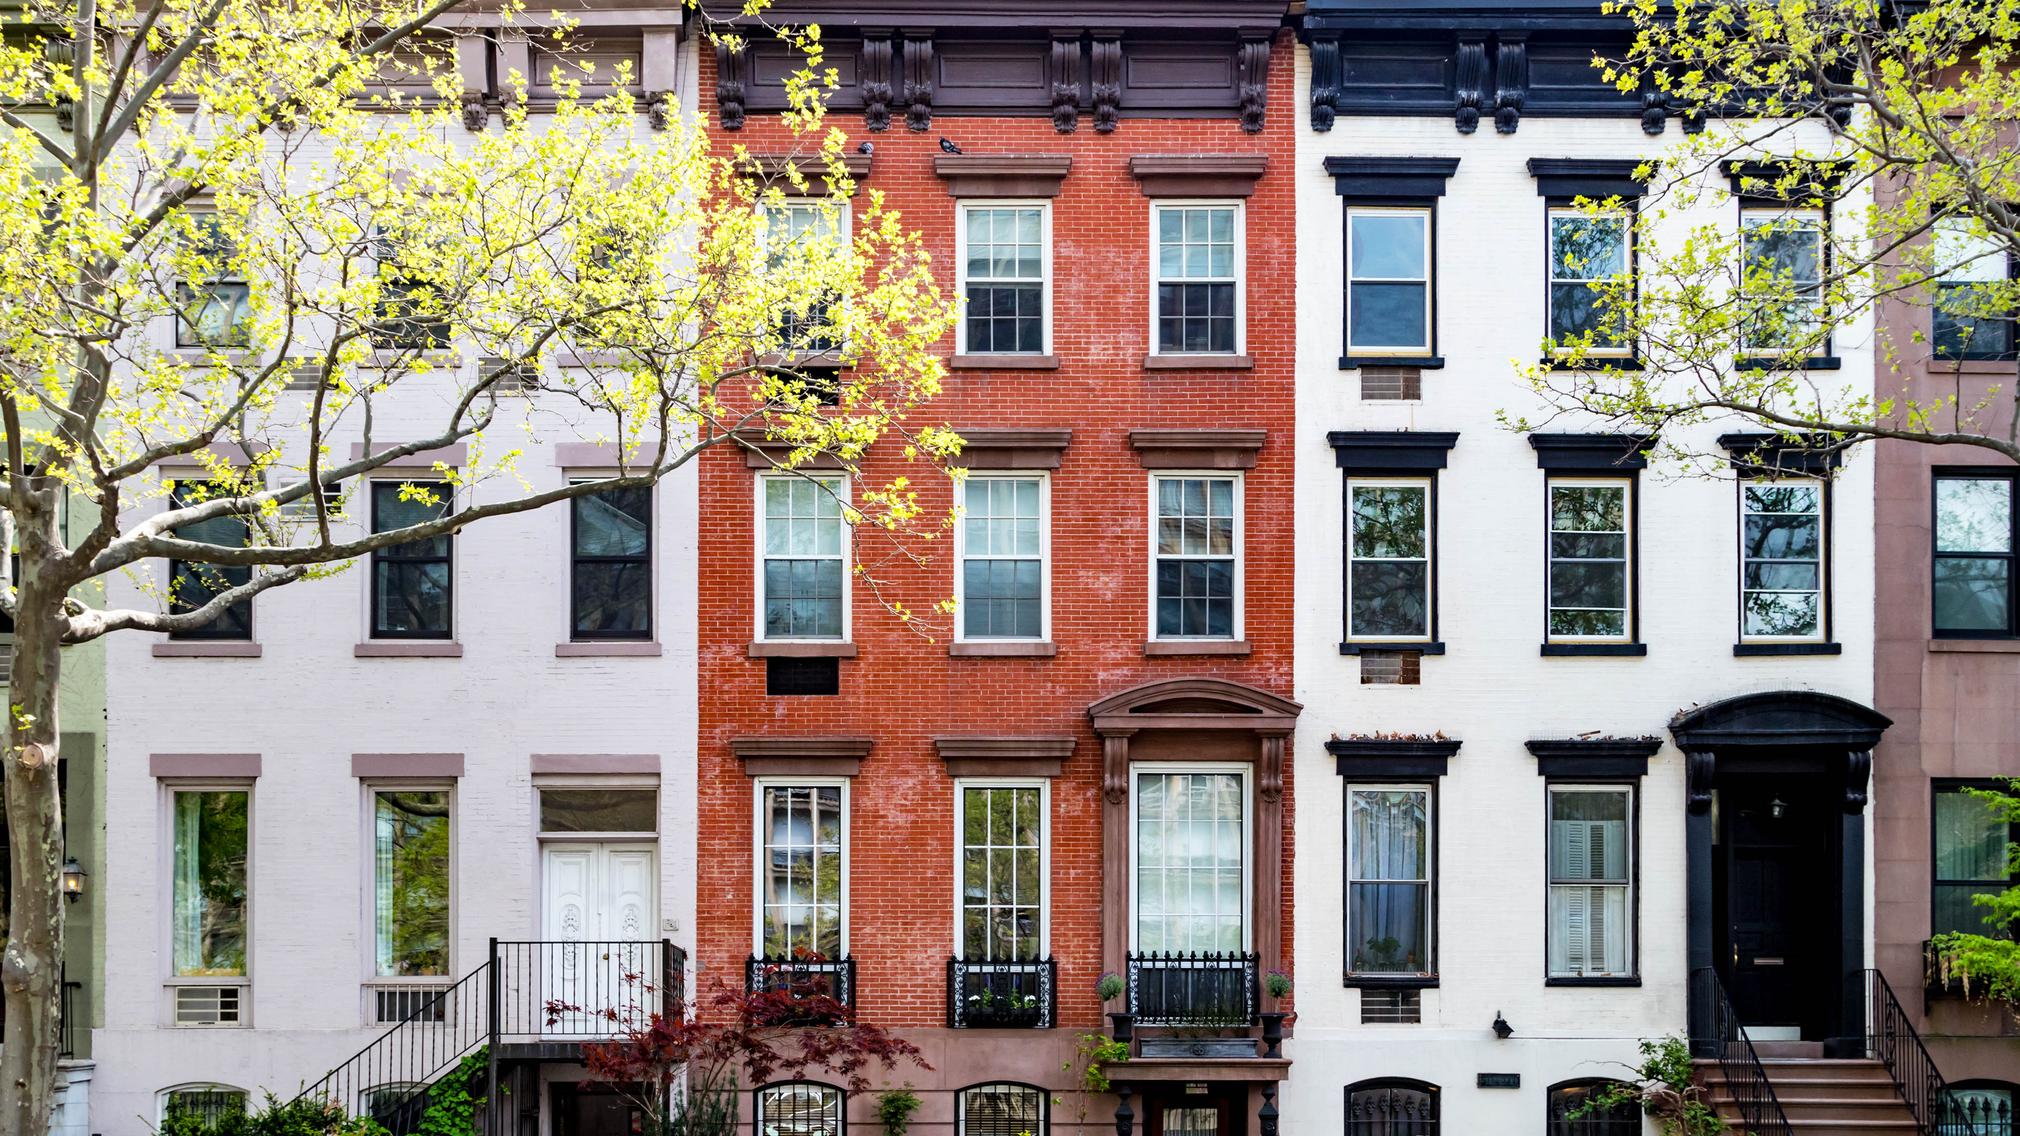
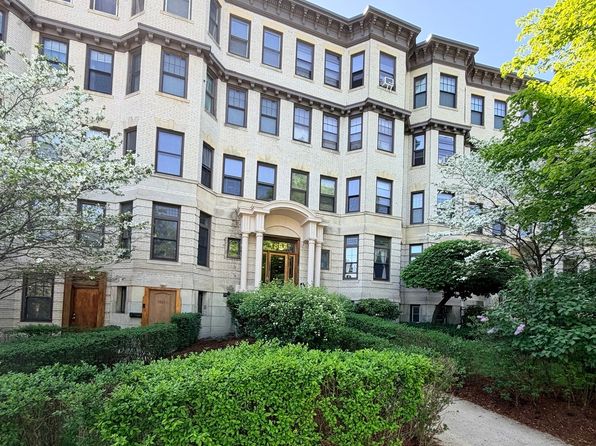
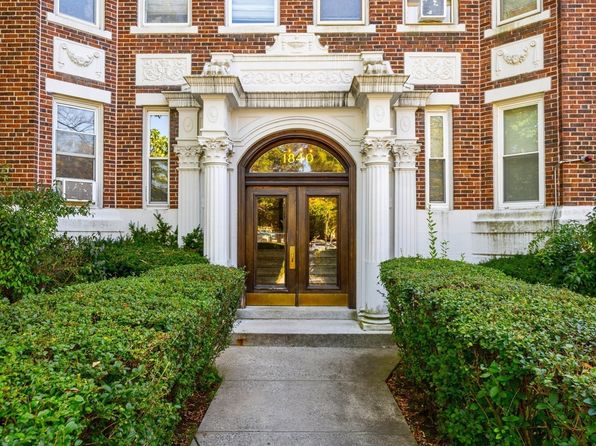
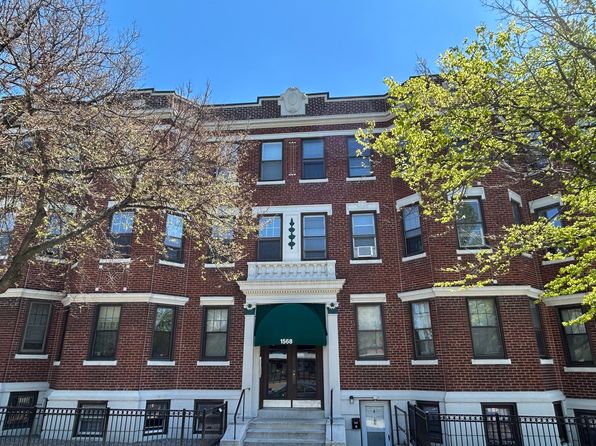
Housing includes detached houses, two- and three-family buildings, brick apartment buildings, and condominium conversions, alongside newer multifamily development. Older wood-frame homes and porches contrast with larger buildings along major corridors such as Commonwealth Avenue. The average home value is $683,646, about the same as a year ago, and the average rent is $3,100/mo. Individual prices vary with building type, condition, size, and location within the neighborhood.
Getting around depends partly on proximity to transit corridors. The MBTA Green Line B branch runs along Commonwealth Avenue, providing rail connections toward central Boston, while bus routes serve Brighton Center, Oak Square, and connecting destinations. Commercial areas offer opportunities to complete errands on foot, though hills and distances between destinations affect walking routes. Road connections also link Brighton with nearby Watertown, Newton, and other Boston neighborhoods.
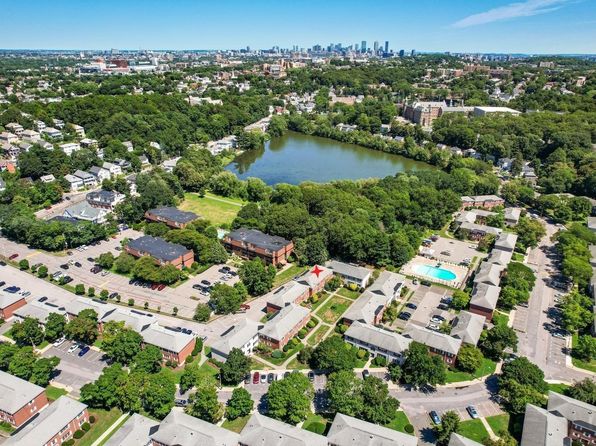
Chandler Pond provides a distinctive waterside landscape, while Rogers Park adds open space and recreation facilities near residential streets. Dining and everyday services cluster around Brighton Center, Oak Square, and major intersections. The combination of neighborhood-scale storefronts, established residential architecture, and larger transit-oriented corridors gives Brighton a varied built environment rather than a single uniform streetscape.
How sale prices have moved over time, and where Brighton sits today. Find rental pricing by zip code.
Average home value in Brighton, Massachusetts is $683,646, essentially unchanged over the past 12 months. As you plan your purchase, aim to keep your mortgage payment at or below 28% of your gross monthly income—your income before taxes and deductions.
Brighton homes spend an average of 35 days on market, a moderate for-sale pace that allows for a measured offer process. Its market temperature is below Fenway's but above the other nearby markets, so buyers face less competitive pressure than in Fenway. Brighton also has the largest for-sale selection here, so buyers have more properties to compare.
| Region | Average home value | Inventory | Days on market | Competitiveness | Key driver |
|---|---|---|---|---|---|
| Brighton | $683,646 | High | 35 days | Lower | Cooler market; broad selection |
| Allston | $801,723 | Low | 14 days | Lower | Cooler market; 51 active listings |
| West End | $579,038 | Low | 88 days | Lower | Cooler market; 30 active listings |
| Fenway | $718,282 | Moderate | 46 days | Moderate | Warmer market; 68 active listings |
| Roxbury | $618,327 | High | 41 days | Lower | Cooler market; 81 active listings |
Brighton and all four nearby markets have excess supply, so renters have room to negotiate across the comparison. Brighton draws less renter interest per listing than Allston, West End and Roxbury, but more than Fenway, so Fenway offers comparatively more negotiating room. Brighton's average active rental listing age is 92 days; it also has the largest rental selection here, giving renters the broadest set of available listings to compare.
| Region | Average rent | Inventory | Average listing age | Competitiveness | Key driver |
|---|---|---|---|---|---|
| Brighton | $3,100/mo | High | 92 days | Lower | Excess supply; broad rental selection |
| Allston | $3,000/mo | High | 96 days | Lower | Excess supply; 2,227 active rentals |
| West End | $3,500/mo | Low | 98 days | Lower | Excess supply; 45 active rentals |
| Fenway | $3,000/mo | Moderate | 90 days | Lower | Excess supply; weakest renter interest |
| Roxbury | $3,400/mo | Low | 59 days | Lower | Excess supply; strongest renter interest |
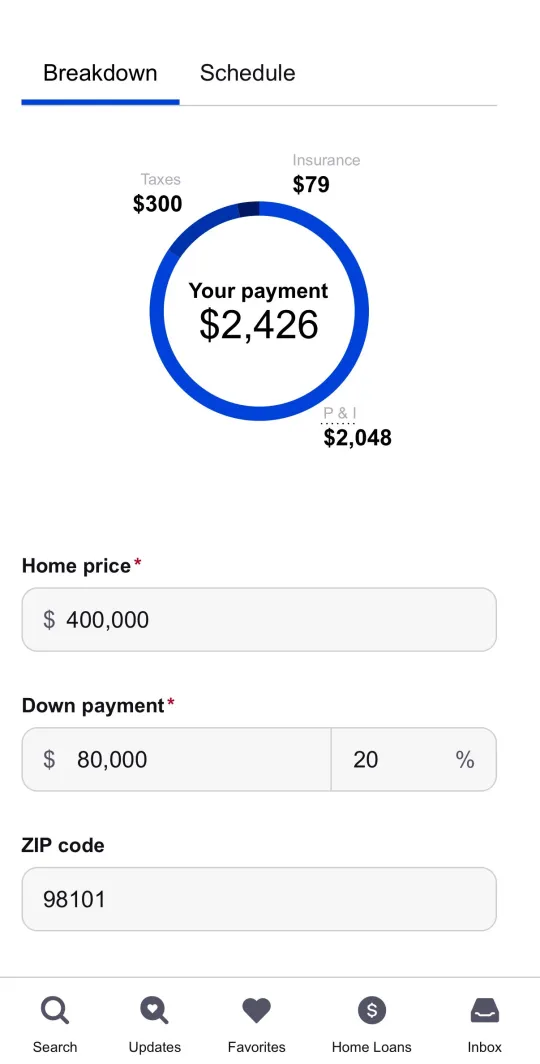
Estimate what it takes to own in this area. Zillow's mortgage calculator helps buyers understand their potential monthly payment-including principal, interest, taxes, and insurance-so they can quickly gauge what home prices fit their budget in this market. Adjust key factors like down payment and interest rate to see how affordability changes and confidently move into your home search.
Not sure whether to rent or buy in this community? This tool compares the long-term costs of both options and shows your breakeven point: the time it takes for buying to become more affordable than renting. Use it to understand how local home prices, rents, and your timeline impact the smarter financial move before starting your search.

See what you can comfortably afford to rent in this area. By factoring in your income, budget, and expenses, Zillow's rent affordability tools help you set a realistic price range-so you can focus on listings that fit your lifestyle and avoid stretching beyond your means as you explore rentals in this market.

Brighton's average sale price falls between Allston and West End, while its rent is higher than Allston's and lower than West End's. Its hilly streets and dispersed commercial centers offer a less concentrated setting than downtown, with walkable shopping areas connected by buses and the Green Line.
| Metric | Brighton | Allston | West End | Fenway | Roxbury |
|---|---|---|---|---|---|
Average sale priceExplore price per property type | $540,000 | $547,250 | $536,667 | $697,000 | $635,000 |
Average rent priceExplore price per unit size | $3,100/mo | $3,000/mo | $3,500/mo | $3,000/mo | $3,400/mo |
Transit access | Buses plus Green Line | Green Line and buses | Multiple subway lines nearby | Green Line branches converge | Orange Line and buses |
Neighborhood vibe | Hilly streets, low-rise buildings | Triple-deckers and commercial corridors | High-rises and landscaped plazas | Brick apartments bordering parkland | Rowhouses, hills, and parks |
Top POIs | Brighton Common (Park); Rogers Park (Park) | Ringer Park (Park); Smith Playground (Park) | West End Museum (Museum); Charlesbank Park (Park) | Fenway Park (Ballpark); Back Bay Fens (Park) | Highland Park (Park); Roxbury Branch Library (Library) |
Start shopping for homes in Brighton. Find 145 homes for sale and 2,071 homes for rent in Brighton. (Listing data as of )
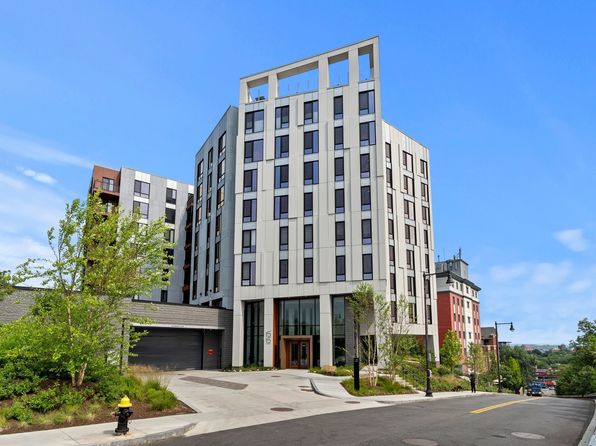



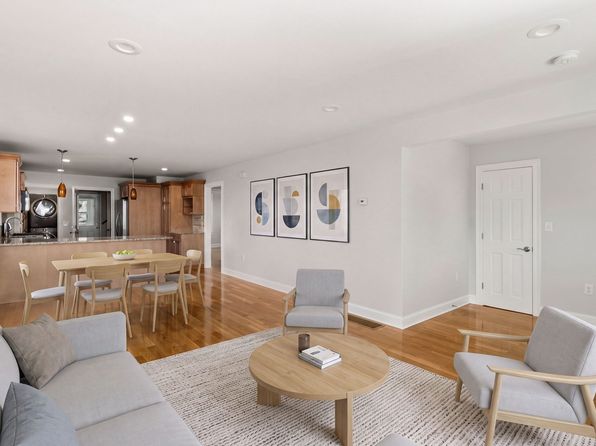
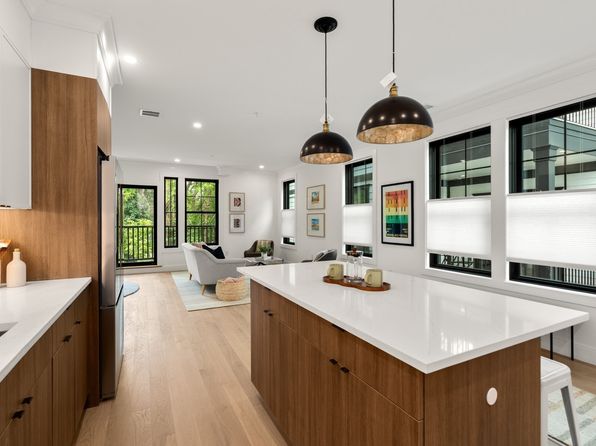
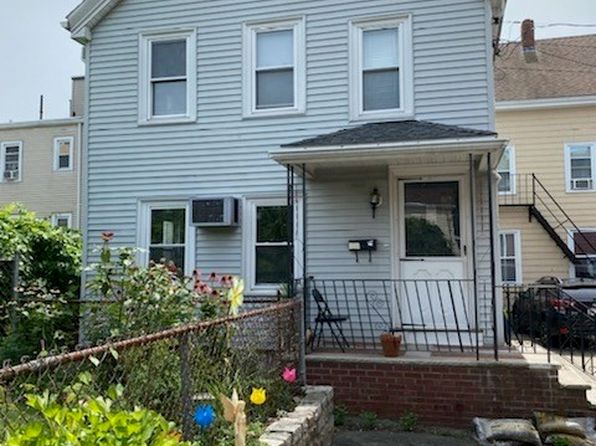
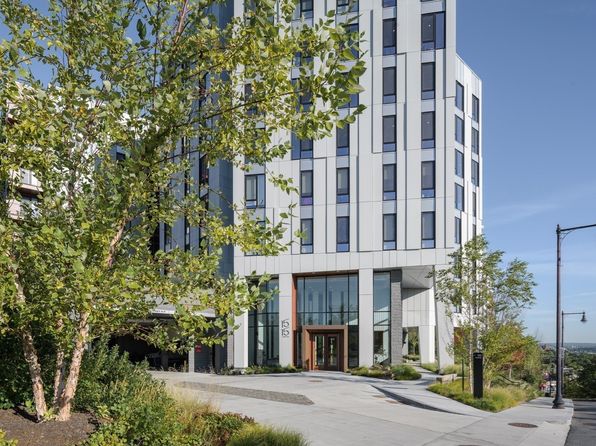









Buying a house can be a complicated, stressful process. Here are 10 steps to help you confidently find your new home.
Knowing how to find an apartment in a competitive rental market can save you time and money. Use our tips to make your search easier.
When it comes to advice about buying a home, agents have first-hand knowledge. Four partner agents share their top 21 home buying tips.
Learn more about what’s involved in renting a house to own it – and what to watch out for.