This 2619 square foot single family home has 5 bedrooms and 3.0 bathrooms. This home is located at 20443 Bloomfield Rd, Riverside, CA 92508.
Pre-foreclosure
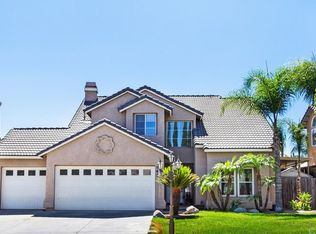
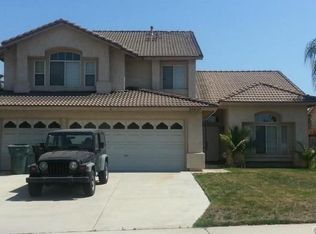
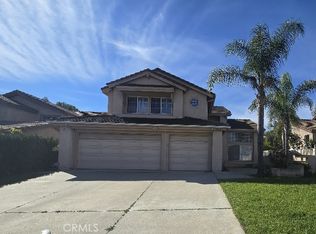
Street View
Est. $758,100
20443 Bloomfield Rd, Riverside, CA 92508
5beds
3baths
2,619sqft
SingleFamily
Built in 1992
7,405 Square Feet Lot
$758,100 Zestimate®
$289/sqft
$-- HOA
Overview
- 37 days |
- 39 |
- 1 |
Facts & features
Interior
Bedrooms & bathrooms
- Bedrooms: 5
- Bathrooms: 3
Heating
- Other
Cooling
- Central
Features
- Has fireplace: Yes
Interior area
- Total interior livable area: 2,619 sqft
Property
Parking
- Total spaces: 3
- Parking features: Garage - Attached
Features
- Exterior features: Stucco
Lot
- Size: 7,405 Square Feet
Details
- Parcel number: 294334027
Construction
Type & style
- Home type: SingleFamily
- Architectural style: Conventional
Materials
- Roof: Tile
Condition
- Year built: 1992
Community & HOA
Location
- Region: Riverside
Financial & listing details
- Price per square foot: $289/sqft
- Tax assessed value: $305,081
- Annual tax amount: $3,374
Visit our professional directory to find a foreclosure specialist in your area that can help with your home search.
Find a foreclosure agentForeclosure details
Estimated market value
$758,100
$720,000 - $796,000
$3,795/mo
Price history
Price history is unavailable.
Public tax history
| Year | Property taxes | Tax assessment |
|---|---|---|
| 2025 | $3,374 +3.4% | $305,081 +2% |
| 2024 | $3,263 +0.5% | $299,100 +2% |
| 2023 | $3,247 +1.9% | $293,237 +2% |
| 2022 | $3,186 +1.2% | $287,488 +2% |
| 2021 | $3,150 +0.8% | $281,852 +1% |
| 2020 | $3,126 +2% | $278,963 +2% |
| 2019 | $3,066 +2% | $273,494 +2% |
| 2018 | $3,005 -3.5% | $268,132 +2% |
| 2017 | $3,114 | $262,875 +2% |
| 2016 | $3,114 +4.9% | $257,721 +1.5% |
| 2015 | $2,968 -0.4% | $253,852 +2% |
| 2014 | $2,980 | $248,882 +0.5% |
| 2013 | -- | $247,760 +2% |
| 2012 | -- | $242,902 +2% |
| 2011 | -- | $238,141 +0.8% |
| 2010 | -- | $236,364 -0.2% |
| 2009 | -- | $236,927 +2% |
| 2008 | -- | $232,283 +2% |
| 2007 | -- | $227,730 +2% |
| 2006 | -- | $223,266 +2% |
| 2005 | -- | $218,889 +3.9% |
| 2003 | -- | $210,667 +2% |
| 2002 | -- | $206,537 +2% |
| 2001 | $2,531 -0.4% | $202,488 +2% |
| 2000 | $2,541 | $198,519 |
Find assessor info on the county website
Monthly payment
Estimated monthly payment$1,822
All calculations are estimates and provided by Zillow, Inc. for informational purposes only. Actual amounts may vary.
HOA fees may include property taxes on listings classified as Co-Ops. Contact the listing agent and/or owner for fee details.
Mortgage interest rates are dependent on a number of factors, including credit score, down payment, and repayment length. Interest rate data provided by Zillow Group Marketplace, Inc. as of 1/1/1970 from various mortgage lenders with which we have lead or other similar arrangements; the Estimated Payment is an average of those rates.
See how much you could borrow to make a competitive offer.
Climate risks
Neighborhood: Orangecrest
Nearby schools
GreatSchools rating
- 7/10Tomas Rivera Elementary SchoolGrades: K-6Distance: 0.5 mi
- 8/10Amelia Earhart Middle SchoolGrades: 7-8Distance: 0.6 mi
- 8/10Martin Luther King Jr. High SchoolGrades: 9-12Distance: 2 mi


- California
- Riverside County
- Riverside
- 92508
- Orangecrest
- 20443 Bloomfield Rd
Nearby cities
Nearby neighborhoods
Nearby zip codes
Other Riverside Topics
