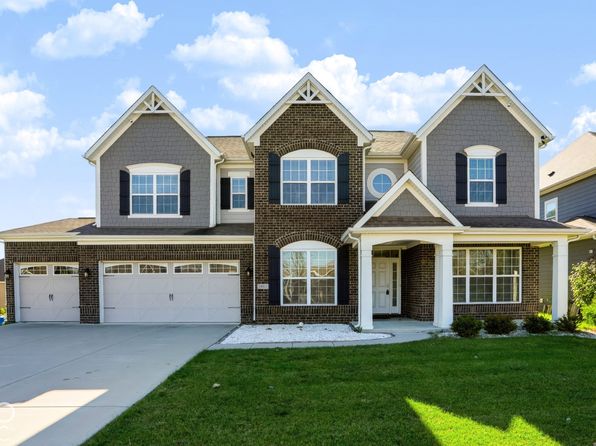
$325,000
- 3 beds
- 3 baths
- 1,816 sqft
7730 Hollow Ridge Cir, Indianapolis, IN 46256

F.C. Tucker Company
Indianapolis is Indiana's capital and part of the Indianapolis-Carmel-Greenwood metro area. The city spreads across mostly level terrain along the White River, with a downtown street grid centered on Monument Circle. Historic commercial corridors and older residential blocks transition to lower-density development farther from the center.
The housing stock includes owner-occupied and rental properties, ranging from detached houses and duplexes to condominiums and apartment buildings. The average home value is $227,445, down 0.9% over the past 12 months. The average rent is $1,375/mo, up 2.6% over the same period. Prices and rents vary by location, property type and condition, so these citywide figures offer context rather than a price for any particular home.
Eli Lilly and Company and IU Health are major employers, alongside government, logistics and other business operations. Interstates connect downtown with surrounding areas, while IndyGo provides bus service, including bus rapid transit. Walkability varies by location: downtown and some commercial districts have closely spaced destinations, while other areas have more dispersed development.
White River State Park links downtown to open space and cultural attractions, including the Indiana State Museum. The Indianapolis Cultural Trail connects central districts, and the Monon Trail extends the city's walking and cycling network. Libraries, grocery stores, restaurants and neighborhood parks provide everyday amenities, with locations and access varying across the city.
How sale and rent prices have moved over time, and where Indianapolis sits today.
Average home value in Indianapolis, Indiana, is $227,445. Home values are down 0.9% over the past 12 months. As a buyer, aim to keep your mortgage payments at or below 28% of your gross monthly income—your income before taxes—to help set your budget.
Average rent in Indianapolis, Indiana, is $1,375/mo. Home values are up 2.6% over the past 12 months. As a renter, aim to spend no more than 30% of your gross monthly income—your income before taxes—on rent to help set your budget.
Indianapolis's market-temperature index indicates less competition than Lawrence, Greenwood and Avon, and the same level as Beech Grove. Its 22 days on market are close to Beech Grove's 24 and Greenwood's 20, and it has the largest for-sale inventory among these markets.
| Region | Average home value | Inventory | Days on market | Competitiveness | Key driver |
|---|---|---|---|---|---|
| Indianapolis | $227,445 | High | 22 days | Lower | Largest for-sale inventory; 22 days on market |
| Lawrence | $266,750 | Low | 32 days | Lower | 32 days on market; 133 active listings |
| Beech Grove | $189,925 | Low | 24 days | Lower | Smallest for-sale inventory; 24 days on market |
| Greenwood | $325,851 | High | 20 days | Lower | Largest nearby for-sale inventory; 20 days on market |
| Avon | $355,153 | Moderate | 16 days | Moderate | Fewest days on market; highest nearby market temperature |
Indianapolis has balanced rental conditions, matching Avon; Lawrence and Greenwood show excess supply, while Beech Grove shows excess demand. Indianapolis also has the largest active rental inventory among these markets. Its median active rental listing age is 47 days, compared with 33 days in Avon and 68 days in Beech Grove.
| Region | Average rent | Inventory | Average listing age | Competitiveness | Key driver |
|---|---|---|---|---|---|
| Indianapolis | $1,375/mo | High | 47 days | Moderate | Balanced conditions |
| Lawrence | $1,540/mo | Moderate | 58 days | Lower | Excess supply; 159 active rentals |
| Beech Grove | $1,246/mo | Low | 68 days | High | Excess demand; 47 active rentals |
| Greenwood | $1,554/mo | High | 51 days | Lower | Excess supply; largest nearby rental inventory |
| Avon | $1,882/mo | Low | 33 days | Moderate | Balanced conditions; 99 active rentals |
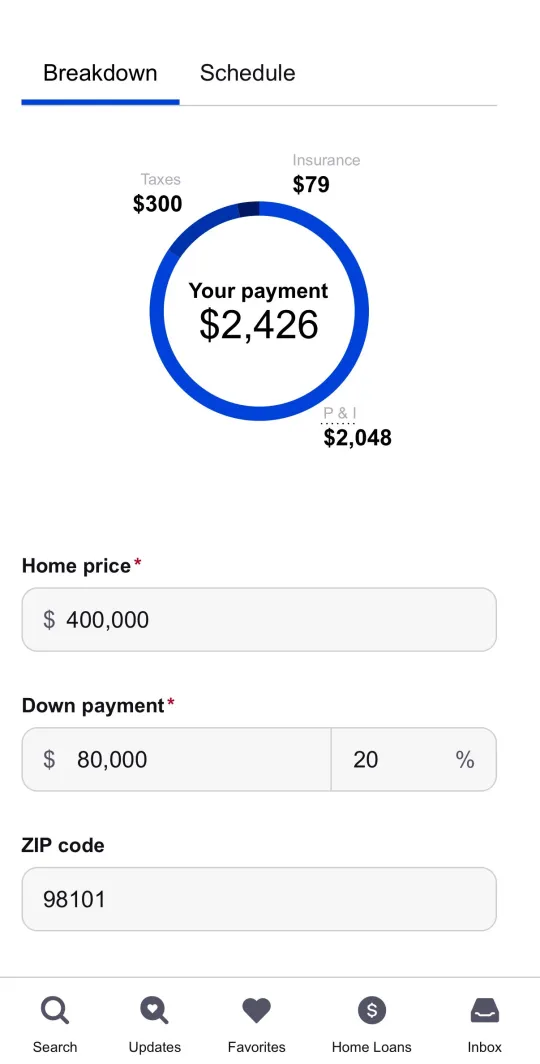
Estimate what it takes to own in this area. Zillow's mortgage calculator helps buyers understand their potential monthly payment-including principal, interest, taxes, and insurance-so they can quickly gauge what home prices fit their budget in this market. Adjust key factors like down payment and interest rate to see how affordability changes and confidently move into your home search.
Not sure whether to rent or buy in this community? This tool compares the long-term costs of both options and shows your breakeven point: the time it takes for buying to become more affordable than renting. Use it to understand how local home prices, rents, and your timeline impact the smarter financial move before starting your search.

See what you can comfortably afford to rent in this area. By factoring in your income, budget, and expenses, Zillow's rent affordability tools help you set a realistic price range-so you can focus on listings that fit your lifestyle and avoid stretching beyond your means as you explore rentals in this market.

Indianapolis has lower average sale prices and monthly rents than Lawrence, Greenwood and Avon, but higher prices and rents than Beech Grove. Indianapolis combines a denser, more walkable downtown and broader bus service with outlying residential areas, while nearby cities generally have more car-oriented layouts.
| Metric | Indianapolis | Lawrence | Beech Grove | Greenwood | Avon |
|---|---|---|---|---|---|
Average sale priceExplore price per property type | $250,983 | $280,800 | $184,500 | $320,812 | $358,500 |
Average rent priceExplore price per unit size | $1,375/mo | $1,540/mo | $1,246/mo | $1,554/mo | $1,882/mo |
Transit access | IndyGo buses; walkable downtown | IndyGo service along corridors | Limited buses; compact street grid | IndyGo connections; car-oriented streets | Car-oriented roads; limited transit |
Neighborhood vibe | Downtown towers, residential street grids | Wooded parks, low-rise development | Compact blocks, traditional storefronts | Historic core, suburban commercial corridors | Low-rise development, expansive green spaces |
Top POIs | White River State Park (Park); Indianapolis Zoo (Zoo) | Fort Harrison State Park (State Park); Lawrence Community Park (Park) | Sarah T. Bolton Park (Park); Don Challis Park (Park) | Craig Park (Park); Old City Park (Park) | Avon Town Hall Park (Park); Avon-Washington Township Public Library (Library) |
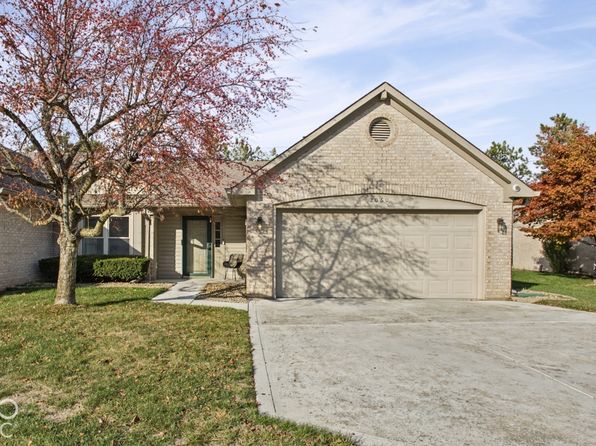
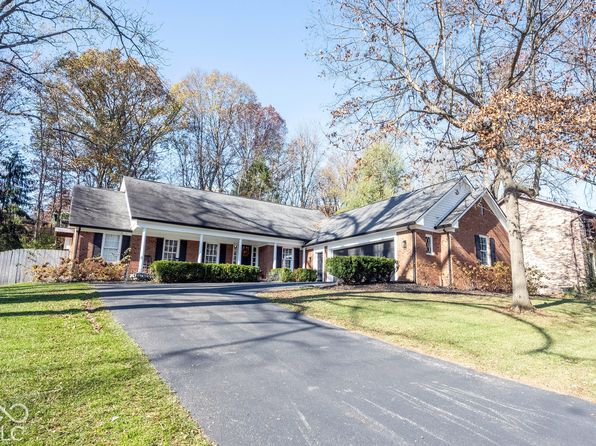
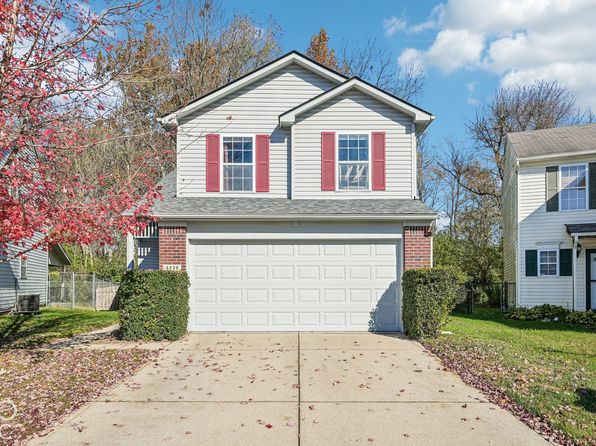
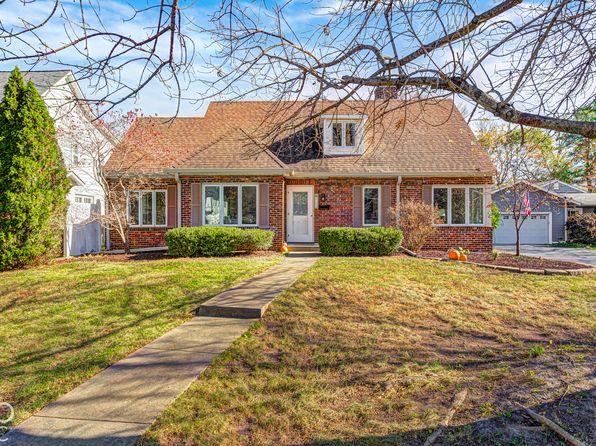
Start shopping for homes in Indianapolis. Find 3,640 homes for sale and 8,865 homes for rent in Indianapolis. (Listing data as of )
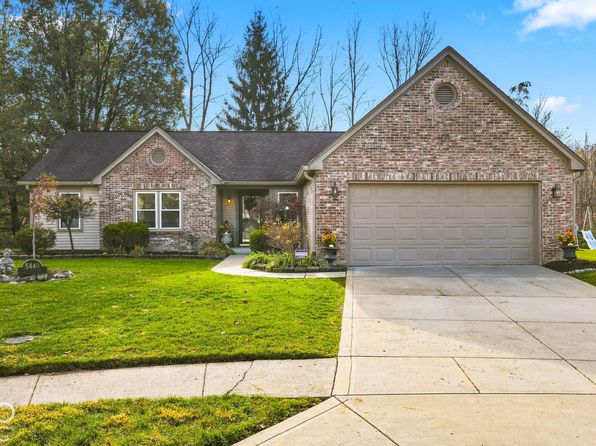
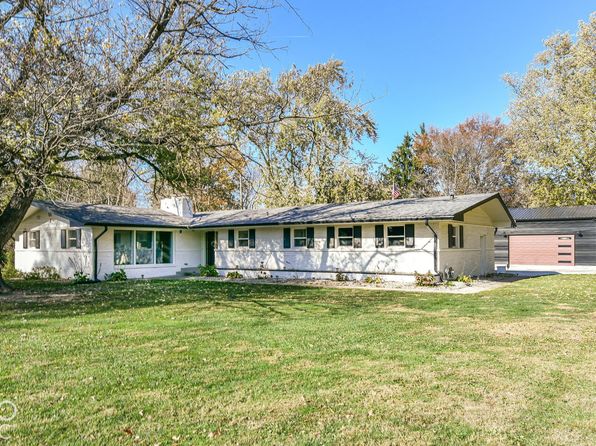














Buying a house can be a complicated, stressful process. Here are 10 steps to help you confidently find your new home.
Knowing how to find an apartment in a competitive rental market can save you time and money. Use our tips to make your search easier.
When it comes to advice about buying a home, agents have first-hand knowledge. Four partner agents share their top 21 home buying tips.
Learn more about what’s involved in renting a house to own it – and what to watch out for.